





Overall Directional Bias
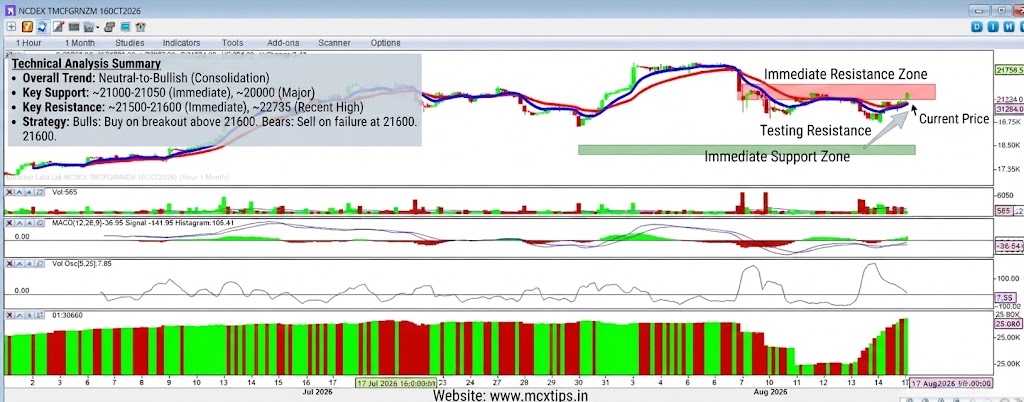
The overall trend is Neutral-to-Bullish (Consolidation after a rally).
- Price Action: After a significant rally from late July to early August, the market has entered a corrective phase. It has formed a potential “bear flag” or a “pennant” pattern, which is a consolidation phase after a strong move. The price is currently trading within this range. It is currently at approximately 21254.0.
- Moving Averages: The short-term (red) moving average is above the long-term (blue) moving average, which confirms the underlying bullish trend. However, the price has recently dipped below the short-term moving average and is now testing the long-term moving average. This is a critical juncture. A breakdown below the blue line would suggest a deeper correction.
- Indicators:
- MACD: The MACD line is hovering just below the signal line, and the histogram is negative (red) but very small, indicating a lack of strong bearish conviction. It is coiling near the zero line, which is typical during consolidation.
- Volume Oscillator: The volume oscillator is showing very low volatility and declining volume, typical during a consolidation phase.
- Open Interest: Open interest shows a significant drop during the recent correction, followed by some accumulation, suggesting traders are closing positions and waiting for a clearer signal.
Conclusion on Direction: The market is in “wait-and-see” mode. The primary trend is up, but the immediate momentum is down. The bias is slightly defensive but could quickly turn bullish if the price breaks above the immediate resistance.
Support Levels (Downside Targets)
These are key levels where buying interest is likely to emerge.
- Immediate Support: ~21000 – ~21050 This is the first and most crucial short-term support level, representing the recent swing lows and the bottom of the current consolidation range, which also aligns with the long-term (blue) moving average. A decisive break below this level would signal the resumption of the correction towards 20000.
- Major Support: ~20000 A major psychological round-number level and the site of a significant previous consolidation zone. This is a critical structural support floor. A drop to this level would be a deeper correction but could present a good buying opportunity.
- Historical Support: ~19000 Farther down, this is the major historical support level from the base of the late July rally. A break below this would be a very bearish signal.
Resistance Levels (Upside Barriers)
These are key levels where selling pressure is likely to increase.
- Immediate Resistance: ~21500 – ~21600 This zone is the first major hurdle to the upside. It encompasses the recent minor swing highs and is where the short-term (red) moving average is currently converging. A break and hold above this level is required to negate the current bearish consolidation pattern and resume the uptrend.
- Minor Resistance: ~21800 – ~22000 Farther up, this zone is the top of the recent consolidation range and is close to the level of the recent swing high. It will act as a formidable psychological and historical barrier.
- Major Resistance (Recent High): ~22735 This is the absolute peak of the current rally. A decisive break above this level is needed to resume the primary uptrend and create a new “higher high.”
Summary Strategy
- Neutral/Cautious: The market is in consolidation. Traders may want to avoid entering large positions until a clear breakout occurs from the current ~21050 – ~21600 range.
- Bulls (Waiting for strength): Wait for a confirmed 1-hour close above the ~21600 resistance level before entering long positions. Your initial target would be 22000, with a tight stop-loss just below 21400.
- Bears (Testing the range): Could look for short entries on any bounce that fails near the 21600 resistance, with a tight stop-loss just above 21700 and an initial target of 21050. A break below ~21050 would be a more confirmed sell signal, targeting 20000.
Disclaimer: This technical analysis is for informational purposes only and does not constitute financial advice. Trading involves risk, including the loss of principal. Please conduct your own research or consult a professional financial advisor before making any trading decisions.
for more updates join our whatsapp group https://chat.whatsapp.com/Jrj3abV2S945BqYiQzOdk9
One Response
Đọc xong thấy rất bổ ích. Letco chuyên du học Hàn Quốc, tư vấn 1-1 theo năng lực và ngân sách từng bạn. Ghé thăm letco.vn để được hỗ trợ.