





Overall Directional Bias
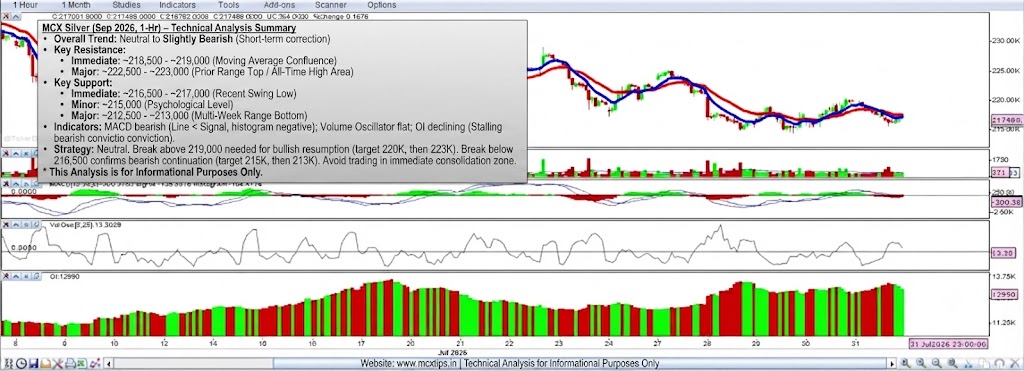
The overall trend is Neutral to Slightly Bearish in the short term.
- Price Action: The price is currently testing its short-term (red) and long-term (blue) moving averages from below, having recently pulled back from a local high. It is forming a series of lower highs and lower lows on this timeframe, indicating a loss of bullish momentum and a potential consolidation or correction.
- Moving Averages: The short-term (red) moving average is now below the long-term (blue) moving average, which typically suggests a bearish bias. The price is struggling to cross back above this combined resistance.
- Indicators:
- MACD: The MACD line is below the signal line, and the histogram is negative, confirming the short-term bearish momentum.
- Volume Oscillator: The volume oscillator is fluctuating near the zero line, suggesting a lack of strong conviction in the recent price moves, which is common during a consolidation.
- OI (Open Interest): Open Interest is declining while the price is moving lower, which can sometimes indicate that the bearish move is not supported by new short positions and could be nearing a point of exhaustion or short-covering.
Conclusion on Direction: The market is at a critical juncture, testing the moving average resistance. A confirmed break above this area would shift the bias to bullish, while failure to do so and a break below the recent lows would confirm the continuation of the bearish correction.
Support Levels (Downside Targets)
These are key levels where buying interest could emerge, potentially halting a decline.
- Immediate Support: ~217,000 – ~216,500 This is the most recent significant swing low and the first line of defense. A break below this level would signal further downside.
- Minor Support: ~215,000 Below that, the 215,000 level acts as a minor psychological support and a zone where the price has consolidated previously.
- Major Support: ~212,500 – ~213,000 This is the major support level, representing the low of the current multi-week range. A break below this level would be a significant bearish development, indicating a potential trend reversal on a larger timeframe.
Resistance Levels (Upside Barriers)
These are key levels where selling pressure is likely to increase, potentially pausing or reversing an upward move.
- Immediate Resistance: ~218,500 – ~219,000 This is the first barrier, defined by the confluence of both the short-term (red) and long-term (blue) moving averages. The price is currently struggling to overcome this area.
- Minor Resistance: ~220,000 Above the moving averages, this round number will act as a minor psychological resistance.
- Major Resistance: ~222,500 – ~223,000 This is the top of the recent consolidation range and a major resistance level. A decisive break above this level is needed to signal the start of a new uptrend and invalidate the current bearish correction.
Summary Strategy
- Neutral: The market is in a “wait and see” mode, testing a key resistance.
- Bulls: Would need to see a confirmed breakout above 219,000 (moving averages) to target 220,000 and then 223,000.
- Bears: Would need to see a break below 216,500 (recent low) to target 215,000 and then 213,000.
Disclaimer: This technical analysis is for informational purposes only and does not constitute financial advice. Trading involves risk, including the loss of principal. Please conduct your own research or consult a professional financial advisor before making any trading decisions.
for more updates join our whatsapp group https://chat.whatsapp.com/Jrj3abV2S945BqYiQzOdk9