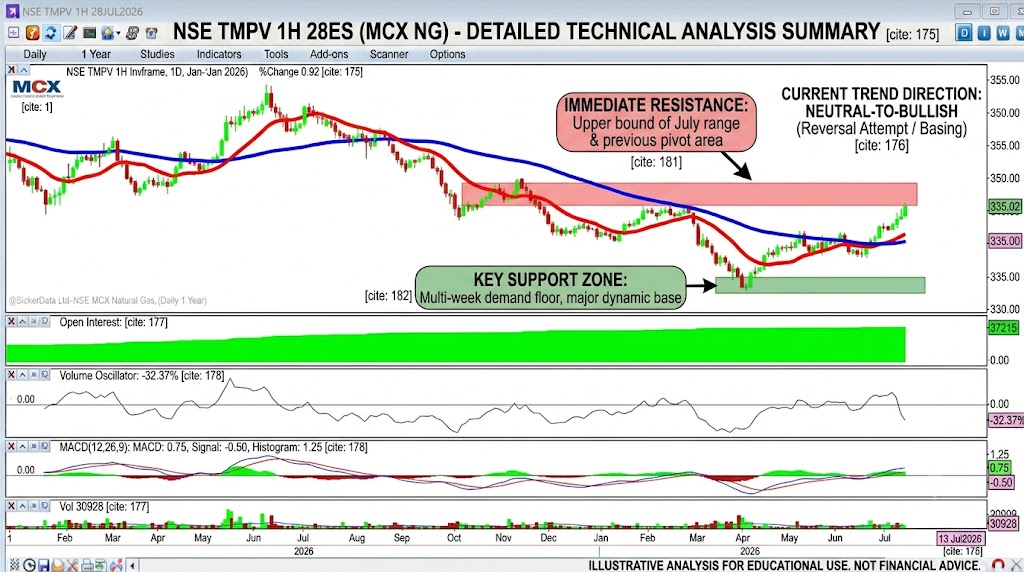



1. Market Trend & Directional Bias
- Primary Trend: Intermediate Downtrend / Broad Consolidation The macro chart structure shows a clear historical decline through the first half of June, falling from highs near 395.00 down to a floor near 335.00. However, throughout late June and July, the aggressive selling pressure ceased, transitioning the stock into a prolonged sideways consolidation channel.
- Trade Direction: Neutral-to-Bullish (Short-term Reversal Attempt) In the immediate short term, the direction is shifting positively. The price has successfully crossed and closed above both the red and blue moving averages, which are now flattening out and beginning to provide dynamic support underneath the candles.
- Momentum Indicators: This bullish shift is supported by the MACD (12,26,9), where the MACD line (0.75) has crossed above the signal line (−0.50), accompanied by an expanding green histogram (1.25), confirming emerging near-term buying momentum.
2. Key Structural Levels
- Resistance Zone: 350.00 – 355.00
- Reasoning: This is the immediate technical ceiling, marking the upper boundary of the July consolidation range and a previous minor pivot area before the stock flattened out. A clean breakout above 355.00 is required to reverse the broader downtrend.
- Support Zone: 335.00 – 338.00
- Reasoning: This acts as the primary horizontal demand floor. It represents the multi-week low established in early July where buyers repeatedly stepped in to absorb supply. The flattening moving averages around 341.00 serve as the first line of dynamic micro-support before this major zone.
Strategic Outlook
The asset is attempting a structural base-building formation near its multi-month lows, currently trading at 344.95. The path of least resistance in the very short term leans toward testing the upper resistance corridor near 350.00, provided the price maintains its footing above the moving average cluster.