





Technical Analysis Summary
- Trade Direction: Neutral-to-Bearish (Short-term Downtrend / Consolidation)
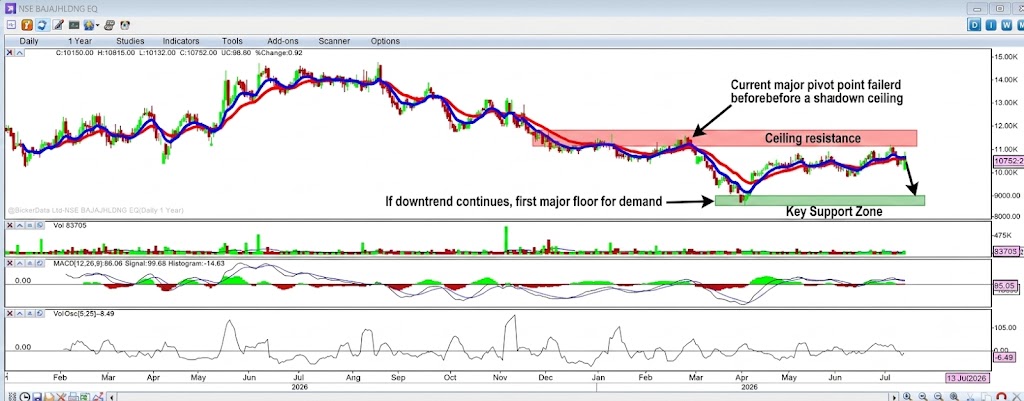
- Reasoning: After peaking around late May and early June with prices well above 14,000, the stock has entered a consistent downward trajectory. Both the red and blue moving average lines are currently sloping downwards and the price is trading well below them, acting as dynamic overhead resistance. While there was a slight bounce in April, it was quickly rejected, confirming bearish control in the medium term. The MACD histogram is hovering near the zero line, showing very little bullish or bearish conviction, indicating that the stock might consolidate before continuing its downward move.
Key Levels
- Resistance: 11,500 – 11,800
- Reasoning: This zone aligns with the recent major pivot point where the price attempted to recover before sharply breaking down. This level also coincides with the location of the descending red moving average, creating a significant technical ceiling.
- Support: 10,000 – 10,200
- Reasoning: This is the key psychological and technical baseline that provided support in early 2026 before the last major rally. If the downtrend continues, this is the first major floor where the price is likely to find demand.
Disclaimer: The provided image is a simulated technical analysis chart based on the data and description available. It is intended for illustrative and educational purposes only. This should not be considered financial advice. All trading involves significant risk, and it is crucial to conduct your own thorough research or consult with a qualified financial advisor before making any investment decisions. Past performance, depicted in this simulated chart, is not a reliable indicator of future results.