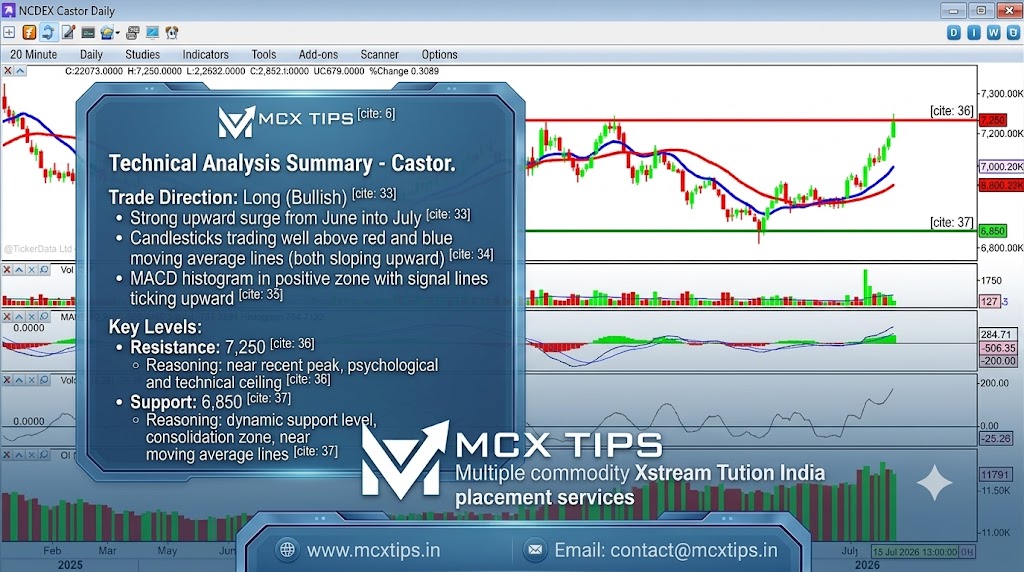



Technical Analysis Summary
- Trade Direction: Long (Bullish)
- Reasoning: The price action demonstrates a strong upward surge starting from June into July. The candlesticks are trading well above both the red and blue moving average lines, which are sloping upwards, indicating solid bullish momentum. The MACD histogram is also hovering in the positive zone with the signal lines ticking upward, supporting the buying pressure.
Key Levels
- Resistance:7,250
- Reasoning: This level sits near the recent peak visible at the top-right of the chart, acting as the immediate psychological and technical ceiling for the current rally.
- Support:6,850
- Reasoning: This functions as the immediate dynamic support level, aligning with the recent consolidation zone just before the final breakout leg and resting near the moving average lines.