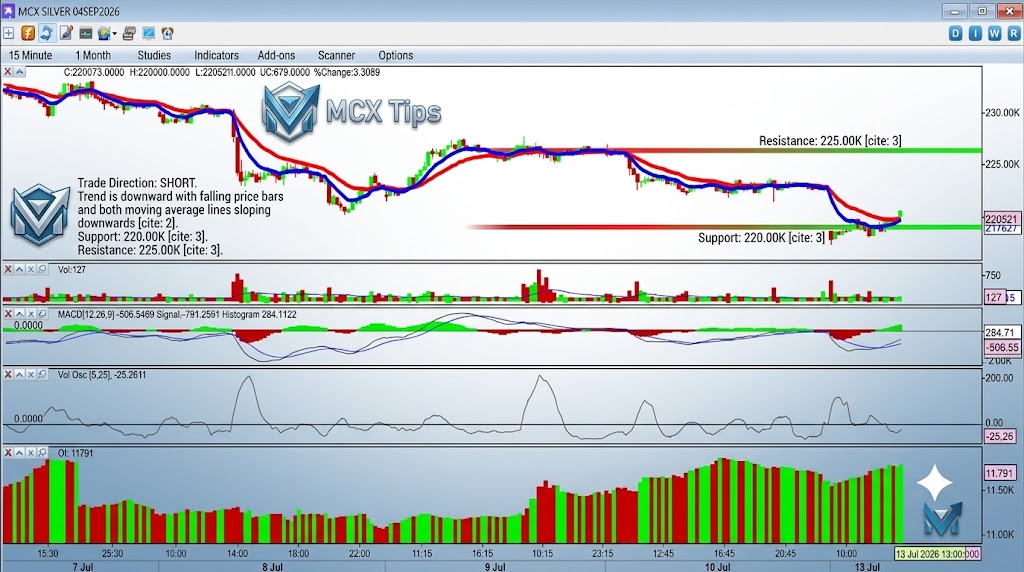



Based on a detailed analysis of the current MCX Silver chart, the market presents a clear downward trajectory, signaling a strategic opportunity for a short position. This bearish outlook is supported by key technical indicators and price action.
The visual evidence on the chart strongly indicates that the overall trend is downward. This is primarily observed through the pattern of falling price bars over a consistent period. Furthermore, two critical moving average lines are both sloping downwards, reinforcing the strength of the current downward momentum and validating the trade direction to be “Short”.
A essential part of any trade strategy involves identifying critical support and resistance levels to manage risk and plan entry/exit points. For MCX Silver, these levels have been clearly identified:
- Resistance: 225.00K. This is a major ceiling price where upward movement has been capped, indicating significant selling pressure at this level.
- Support: 220.00K. This level represents the immediate floor price where dynamic support is expected to pause or potentially reverse the downward trend, although the current bias remains bearish.