




Overall Trend: Bearish (Short-Term)
Analysis:
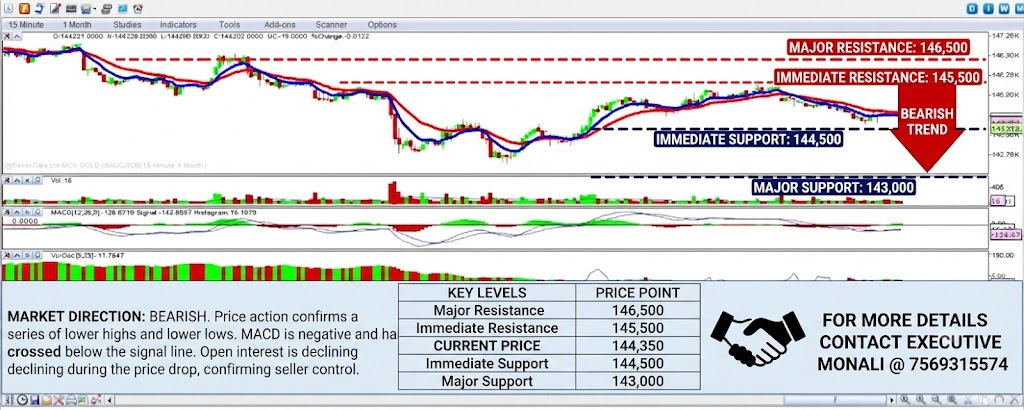
- Price Action: The chart clearly shows a downtrend. The price is consistently forming lower highs and lower lows, trading below both the short-term (blue) and medium-term (red) moving averages. The most recent candles are bearish, indicating selling pressure.
- Moving Averages: The moving averages are trending downwards, and the shorter-term blue moving average is below the longer-term red moving average, which is a classic bearish signal on this timeframe.
- Technical Indicators:
- MACD: The MACD line is below the signal line, and the histogram is negative, confirming bearish momentum.
- Volume Oscillator: The volume oscillator is showing a decline, suggesting a lack of strong buying interest to reverse the downtrend.
- Open Interest: The Open Interest (OI) has been decreasing, which often indicates that traders are unwinding positions, but in the context of a downtrend, it can also suggest that sellers are in control without strong new buying.
Conclusion: The immediate direction for Gold remains Bearish. The price is expected to continue testing lower levels. A reversal would require a strong break above the moving averages and a shift in momentum indicators.
Key Support and Resistance Levels
- Immediate Resistance (R1): ~145.5K (The blue moving average and a recent minor swing high)
- Major Resistance (R2): ~146.5K (The red moving average and a significant previous resistance zone)
- Immediate Support (S1): ~144.5K (Recent swing low)
- Major Support (S2): ~143.0K (Next significant historical support level)
Disclaimer: This analysis is based on the provided chart snapshot and is for informational purposes only. It does not constitute financial advice. All trading involves risk.