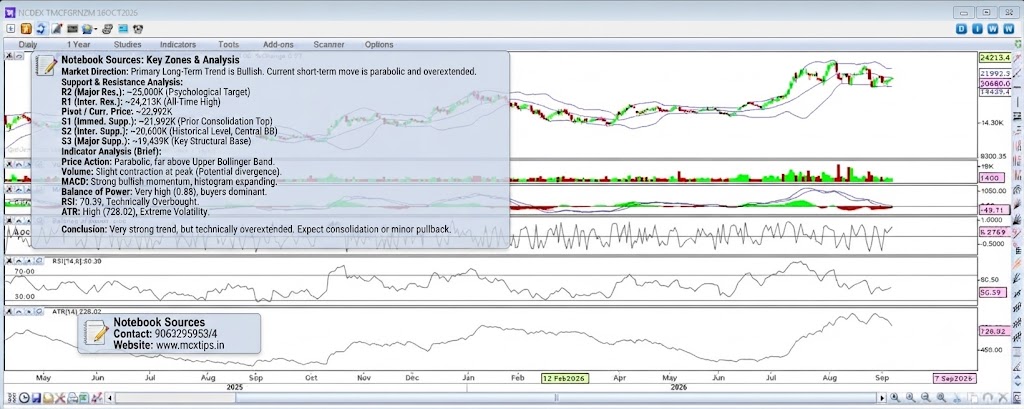



Based on the technical analysis chart for NCDEX TMCFGRNZM 16OCT2026 (Daily, 1 Year), here is a detailed breakdown of support and resistance levels, along with a comprehensive analysis of every visible indicator.
Market Direction
- Medium-to-Long Term: Bullish. The chart displays a clear, sustained long-term uptrend originating from lows near 14.30K in early 2025, culminating in the current peak around 24213.4.
- Short Term: Strongly Bullish to Overextended. The most recent price action is an impulsive, near-vertical rally that has broken significantly above the upper Bollinger Band®. While the trend is up, this type of move often precedes a pullback or period of consolidation.
Support & Resistance Analysis
| Level Type | Price / Zone (Approx) | Description & Significance |
|---|---|---|
| Major Resistance (R2) | ~25,000K | A major psychological round number and the next significant historical or technical target above the current high. |
| Intermediate Resistance (R1) | ~24,213.4 | The immediate, all-time high achieved in the most recent session. A break above this would continue the parabolic move. |
| Current Price / Pivot | 22,992.3 | The immediate market equilibrium point within the current volatile range. |
| Immediate Support (S1) | ~21,992.3 | The top of the previous consolidation range and a level that acted as resistance before the breakout. |
| Intermediate Support (S2) | ~20,600.0 – 20,900.0 | A strong historical support zone, tested multiple times. It also aligns with the central (moving average) Bollinger Band® and the peak of a previous rally. |
| Major Support (S3) | ~19,439.4 | The major structural base and a key pivot point from the last major consolidation phase in early 2026. |
Indicator Analysis
1. Price Action (Candlesticks & Bollinger Bands®)
- Observation: The candles show powerful bullish momentum, with a series of large green bars closing near their highs. The price has extended far above the upper Bollinger Band® and has caused the bands to expand significantly.
- Interpretation: This confirms an extremely strong, overbought short-term trend. While bullish, a “return to the mean” is highly probable, meaning the price is likely to either pull back or consolidate sideways to allow the bands to catch up.
2. Volume (Sub-panel 1)
- Observation: Volume spiked dramatically during the initial phases of the breakout but has recently shown signs of slightly lower bars on the most recent, highest-reaching candles.
- Interpretation: This minor volume contraction at the very peak, while the price is still rising, can be an early divergence signal. It suggests the buying pressure may be slightly weakening, although volume remains relatively high overall, indicating continued participation.
3. MACD [12,26,9] (Sub-panel 2)
- Observation:
- MACD Line (Blue): Well above the zero baseline and still rising steeply.
- Signal Line (Grey): Also rising, but well below the MACD line.
- Histogram (Red/Green Bars): The histogram is positive and has recently expanded higher, with a current reading of 102.38.
- Interpretation: This is a very bullish signal. It confirms strong and accelerating upward momentum. There are no immediate signs of a MACD bearish crossover or divergence to suggest the trend is ending.
4. Balance of Power (Sub-panel 3)
- Observation: This indicator is oscillating but maintains a strong positive bias, with a current high reading of 0.88.
- Interpretation: A reading of 0.88 indicates that buyers are in absolute control and have been aggressively pushing the price higher, especially in the most recent sessions. There is no sign of selling pressure dominance.
5. RSI [14] (Sub-panel 4)
- Observation: The Relative Strength Index is at 70.39.
- Interpretation: The RSI is exactly at the traditional “overbought” threshold of 70. This confirms the extreme bullishness of the short-term move but also signals that the market is stretched and vulnerable to a pullback.
6. ATR [14] (Sub-panel 5)
- Observation: The Average True Range is currently high at 728.02, reflecting significantly increased daily price fluctuations.
- Interpretation: This confirms the high volatility environment suggested by the Bollinger Band expansion. Traders should be prepared for larger-than-average price swings.
Conclusion
The chart for NCDEX TMCFGRNZM is in a very strong, albeit technically overextended, primary bullish trend. All indicators (MACD, RSI, Balance of Power, Bollinger Bands®) point to powerful short-term momentum. However, the price action is parabolic and far above the upper band, the RSI is at overbought levels, and there is a minor volume divergence.
The most likely immediate scenario is a period of consolidation (sideways movement) or a minor pullback to test support at S1 (~21,992K). A break above R1 (~24,213K) would signal a continuation of the parabolic move, while a break below S2 (~20,600K) would indicate a more significant correction.