




Overall Trend Analysis (Direction)
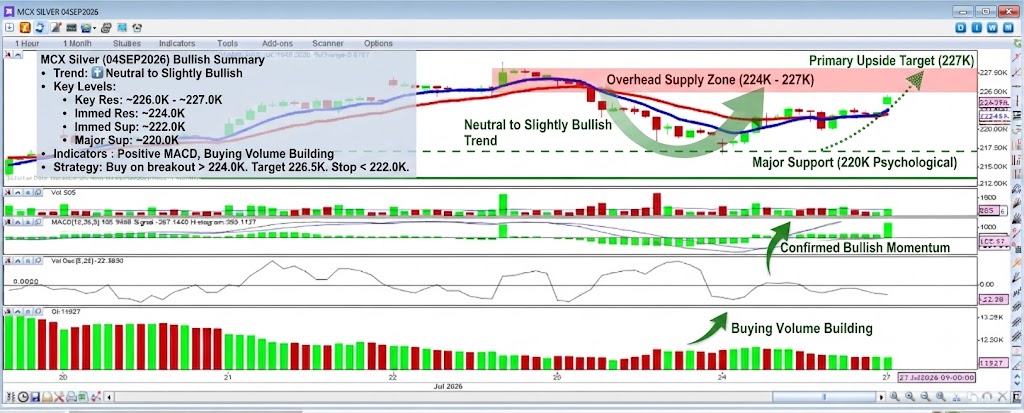
The overall short-term trend is Neutral to Slightly Bullish.
- Price Action: The price is currently in a corrective phase after a recent strong uptrend. It has pulled back and is now consolidating, forming a potential “higher low” relative to the previous swing low. It is trading just above both the short-term red moving average and the longer-term blue moving average, which are beginning to flatten out and could cross over to the bullish side if the price continues to rise. The most recent candles show signs of buying interest at the lower levels.
- Indicators:
- MACD: The MACD line has crossed above the signal line, and the histogram is positive. This confirms the shift in momentum to the bullish side.
- Volume Oscillator: The oscillator is trending upwards towards the zero line, suggesting that buying volume is increasing.
- Volume Bars: The most recent volume bars show a mix of green (buying) and red (selling), but the buying volume seems slightly more dominant as the price holds its ground.
Conclusion: The bias is to the upside. The market is likely to test higher resistance levels. A confirmed break above the recent high would signal a continuation of the larger uptrend.
Support and Resistance Levels
These levels have been derived from recent price action and key psychological points on the chart.
Resistance Levels (Upside Barriers)
- Immediate Resistance: ~224.0K (Current Price Zone / MAs) The price is currently hovering around this level, which also coincides with the short-term moving averages. A clear, sustained break above this zone would be the first confirmation of a renewed bullish move.
- Key Resistance: ~226.0K – ~227.0K (Recent Swing Highs) This zone marks the area of recent selling pressure. A break above 227,000 would be a very strong bullish signal, likely leading to a test of higher levels.
Support Levels (Downside Targets)
- Immediate Support: ~222.0K (Psychological Level / MAs) This major psychological round number and the area where the moving averages are converging serves as the immediate support. As long as the price holds above this, the bullish bias remains intact.
- Major Support: ~220.0K (Psychological Level) This major psychological level is the next significant downside target. It also corresponds to a prior area of price structure where the market found support.
- Longer-Term Support: ~217.5K Further down, this level represents a deeper correction and is a longer-term structural support zone.
Summary Strategy:
- The current bias is bullish.
- Short-term traders might look for buying opportunities on a confirmed breakout above the ~224.0K resistance zone, with a stop-loss just below the ~222.0K support area, targeting the ~226.5K level.
- Risk-averse traders may prefer to wait for a clearer break and retest of the ~224.0K level before entering a long position.
- A breakdown below the ~222.0K support zone would invalidate the immediate bullish bias and could lead to a retest of the ~220.0K level.
Disclaimer: This is a technical analysis for informational purposes only and does not constitute financial advice. Markets are volatile and can change direction quickly.