




Overall Trend Analysis (Direction)
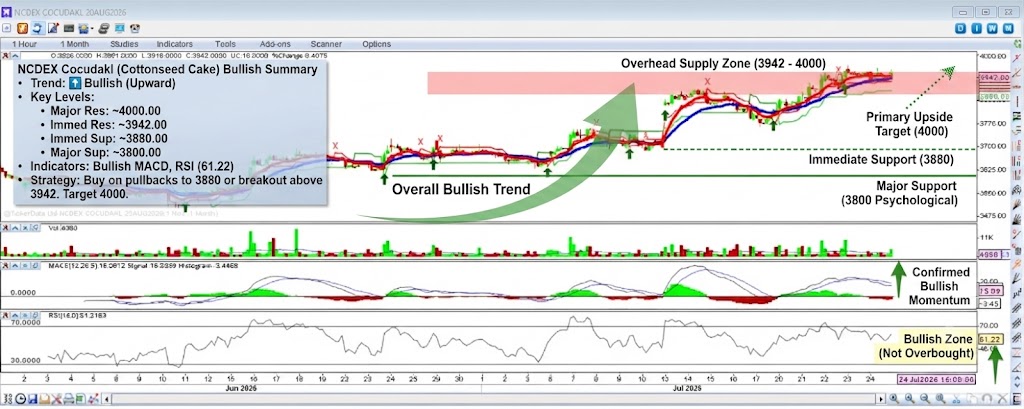
The overall short-term trend is Bullish (Upward).
- Price Action: The price has been in a steady uptrend, forming a series of higher highs and higher lows. It is currently trading above both the short-term red moving average and the longer-term blue moving average, which are also trending upwards. The most recent price action has pushed to a new local high, indicating continued buying pressure.
- Indicators:
- MACD: The MACD line is above the signal line, and the histogram is positive, confirming strong bullish momentum.
- RSI: The RSI is at 61.22 and is trending upwards. This is in the bullish zone, indicating that buying pressure is dominant. It is not yet in overbought territory (above 70), suggesting that there is still room for the price to move higher.
Conclusion: The direction is up. The market is in a strong uptrend with no clear signs of reversal yet.
Support and Resistance Levels
These levels have been derived from recent price action and key psychological points on the chart.
Resistance Levels (Upside Barriers)
- Immediate Resistance: ~3942.00 (Current High) This is the most recent swing high and the current price level. A break above this level would signal a continuation of the uptrend.
- Major Resistance: ~4000.00 (Psychological Level) This is a major psychological round number and the next significant target above the current highs.
- Deeper Resistance: ~4050.00 Further up, this level represents the next potential area of interest based on prior structure.
Support Levels (Downside Targets)
- Immediate Support: ~3880.00 This is a recent minor swing low and aligns approximately with the short-term red moving average. It is the first line of defense for the bulls.
- Major Support: ~3800.00 (Psychological Level / Prior Consolidation) This major psychological round number and prior consolidation area is the next key downside target. It is also where the longer-term blue moving average is currently positioned. This is a critical zone to hold for the integrity of the uptrend.
- Long-Term Support: ~3700.00 Further down, this level represents a deeper correction and is a longer-term structural support zone.
Summary Strategy:
- The bias is bullish.
- Traders might look for buying opportunities on pullbacks to the immediate support level (~3880.00) or on a confirmed breakout above the immediate resistance (~3942.00).
- A stop-loss would typically be placed just below the entry point, for example, below the ~3880.00 support level.
- The primary upside target is the psychological level at ~4000.00.
- A long-term investor should maintain their position as long as the price remains above the major support zone of ~3800.00.
Disclaimer: This is a technical analysis for informational purposes only and does not constitute financial advice. Markets are volatile and can change direction quickly.