




Overall Trend Analysis (Direction)
The overall trend is Bearish (Downward).
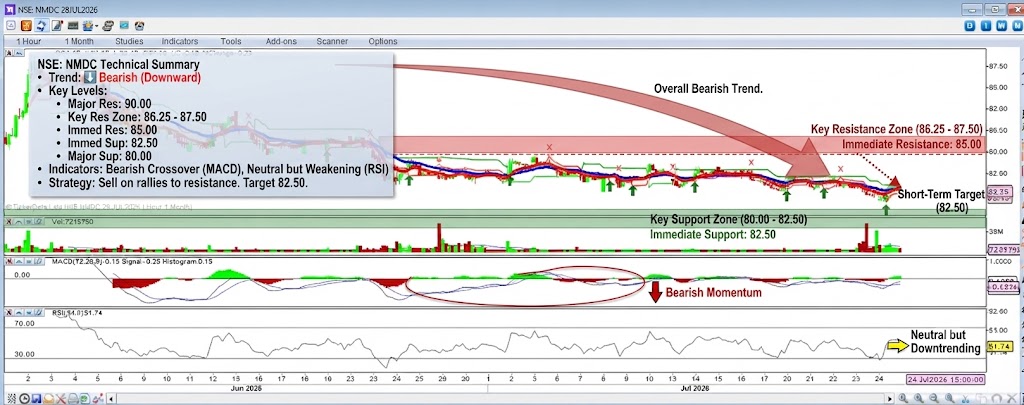
- Price Action: The price has formed a clear series of lower highs and lower lows over the past month, indicating a strong downtrend. It is currently trading below both the short-term red moving average and the longer-term blue moving average, which are acting as dynamic resistance. Recent candles are showing small bodies and indecision, suggesting the selling pressure might be taking a short breather, but the trend remains firmly down.
- Indicators:
- MACD: The MACD line is negative and slightly below its signal line. The histogram is very close to zero but has shown some recent small red bars, indicating a continuation of bearish momentum.
- RSI: The RSI is at 51.74. This is in the neutral zone, having recently moved up from oversold levels. While it’s not giving a strong bearish signal right now, it also doesn’t confirm any upward momentum. It’s simply reflecting a pause in the decline.
Conclusion: The direction is down. The current price action is a consolidation phase within a downtrend. Any rallies are likely to be met with selling pressure at higher levels.
Support and Resistance Levels
These levels have been derived from recent price action and key psychological points on the chart.
Resistance Levels (Upside Barriers)
- Immediate Resistance: 85.00 This is the first significant psychological and structural resistance level. The price has struggled to break above this level during recent minor upward attempts (visible with the green arrow and red ‘X’ marks).
- Key Resistance: 86.25 – 87.50 This zone represents a more substantial area of overhead supply, where previous selling pressure was strong. The blue moving average is currently near the top of this zone, adding to its significance.
- Major Resistance: 90.00 A major psychological level. A break above this would be required to even begin considering a shift in trend from bearish to neutral.
Support Levels (Downside Targets)
- Immediate Support: 82.50 This is the most recent swing low. A break below this level would signal a continuation of the primary downtrend to new lows.
- Major Support: 80.00 This is a major psychological round number. It is also near the lower end of the price action on this chart. A breakdown below this level would be a significant bearish event.
Summary Strategy:
- The bias is bearish.
- Short-term traders might look for selling opportunities on rallies to resistance levels (like 85.00), with a stop-loss just above the resistance and a target of the 82.50 support.
- Long-term investors should avoid this stock until a clear reversal pattern emerges, such as a break above the 87.50 resistance and a subsequent higher low. The primary risk is a break below 82.50, which would likely lead to further losses.
Disclaimer: This is a technical analysis for informational purposes only and does not constitute financial advice. Markets are volatile and can change direction quickly.