





1. Market Trend & Directional Bias
- Primary Trend: Intermediate Downtrend / Base Building The broader chart shows a historical decline through early to mid-June, dropping from highs near $270.00$ down to a major cycle floor near $230.00$. However, since late June and into July, the intense selling pressure has subsided, allowing the asset to build a stable bottoming structure.
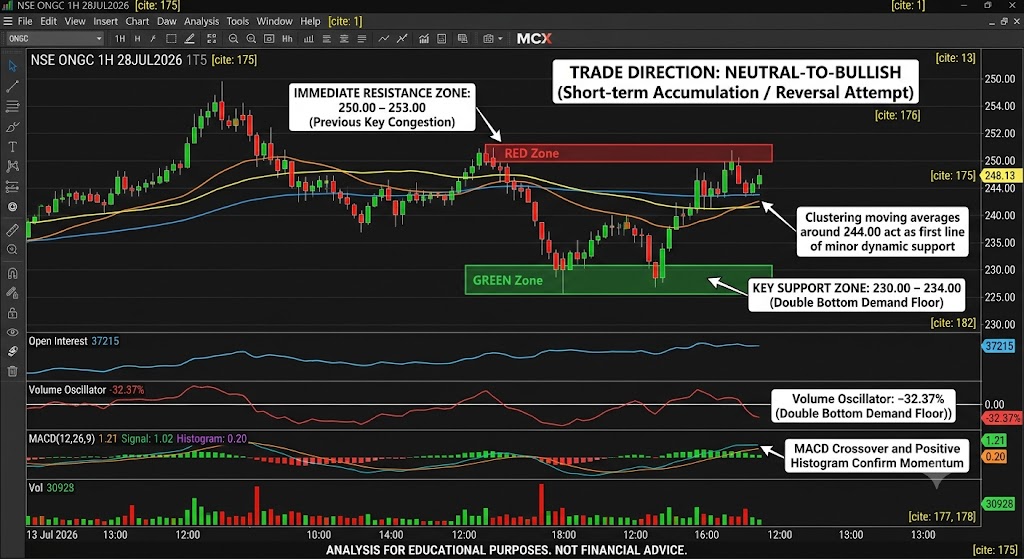
- Trade Direction: Neutral-to-Bullish (Short-term Accumulation) In the immediate term, the price action is shifting positively. The price has successfully crossed and closed above both the red and blue moving averages, which are now sloping gently upward and providing dynamic support underneath the candles.
- Momentum Indicators: This constructive stance is confirmed by the MACD ($12, 26, 9$), where the MACD line ($1.21$) is holding above the signal line ($1.02$) with a positive histogram ($0.20$), indicating stable near-term buying momentum.
2. Key Structural Levels
- Resistance Zone: 250.00 – 253.00
- Reasoning: This is the immediate technical ceiling, marking a previous key congestion area from mid-June where the stock consolidated before its final leg down. A clean daily close above $250.00$ is needed to confirm a complete trend reversal.
- Support Zone: 230.00 – 234.00
- Reasoning: This serves as the primary multi-week horizontal demand floor. It marks the structural double-bottom area established at the end of June where strong buying interest emerged to halt the downtrend. The clustering moving averages around $244.00$ act as the first line of minor dynamic support.
Strategic Outlook
The asset is currently executing a structural accumulation phase near its multi-month lows, trading at 248.13. The path of least resistance in the short term leans toward testing the psychological ceiling at $250.00$, as long as the price sustains its position above the active moving average lines.
Disclaimer
The technical analysis and insights shared above are based entirely on the provided text records summarizing historical chart data. This content is compiled exclusively for illustrative and educational purposes and does not constitute formal financial, investment, or trading advice.
All trading activities involve a high degree of capital risk. It is vital to perform your own extensive research or consult with a qualified financial expert prior to executing any market orders or making investment commitments. Past market behavior and performance, as described in these summaries, do not serve as a reliable predictor or guarantee of future financial results.