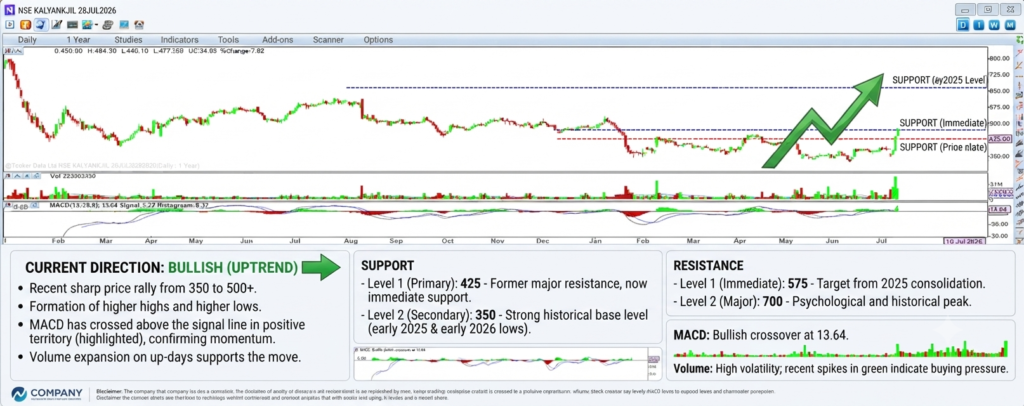



Market Overview: Decisive Rally
The daily price chart for NSE KALYANKJIL, dated July 28, 2026, presents a compelling picture of a confirmed bullish uptrend. The stock has experienced a recent sharp rally, powering from a low of 350 to a current price above 500+. This significant upward move is characterized by a constructive technical pattern of higher highs and higher lows, signaling strong and sustained buying interest.
Key Technical Indicators Validate Momentum
The bullish momentum is not just visible in the price action but is strongly validated by key technical indicators presented in the analysis.
- MACD Confirmation: A critical development is the MACD (Moving Average Convergence Divergence) indicator. As highlighted in the report, the MACD line has crossed above its signal line while in positive territory. This classic bullish crossover is a primary signal of accelerating upward momentum and often marks the beginning of a more substantial price advance.
- Volume Expansion: The rally is underpinned by robust volume characteristics. The analysis notes “volume expansion on up-days,” a crucial sign that the price increase is supported by genuine market conviction and institutional buying, rather than just a lack of sellers.
Critical Price Levels: Support and Resistance
Understanding key price levels is essential for managing risk and identifying potential targets. The analysis provides clear levels based on historical data.
Support Levels (Areas where buying interest is likely to emerge):
- Level 1 (Primary): 425: This level is significant as it represents a former major resistance zone. Having been broken to the upside, it is now expected to act as a strong immediate support.
- Level 2 (Secondary): 350: This is the primary base level, confirmed by historical lows from both early 2025 and early 2026. A drop to this level would present a major buying opportunity.
Resistance Levels (Areas where selling pressure may increase):
- Level 1 (Immediate): 575: This is the first near-term target for the bulls, based on a prior consolidation area from 2025.
- Level 2 (Major): 700: This is the major, psychological, and historical peak for the stock. Reaching this level would be a significant milestone and a major test for the current uptrend.
Conclusion
The technical analysis for NSE KALYANKJIL as of July 28, 2026, paints a decisively bullish picture. With a confirmed uptrend, a bullish MACD crossover, and strong volume support, the path of least resistance appears to be upwards. The immediate focus for the bulls will be overcoming the 575 resistance level, with the longer-term major target set at the historical 700 peak. The well-defined support levels of 425 and 350 provide clear zones for managing long positions.
Disclaimer: This article is for informational purposes only and does not constitute financial advice. All trading involves risk. Consult with a financial advisor before making investment decisions.