




Wanbury Ltd.
1. Price Action (Main Chart)
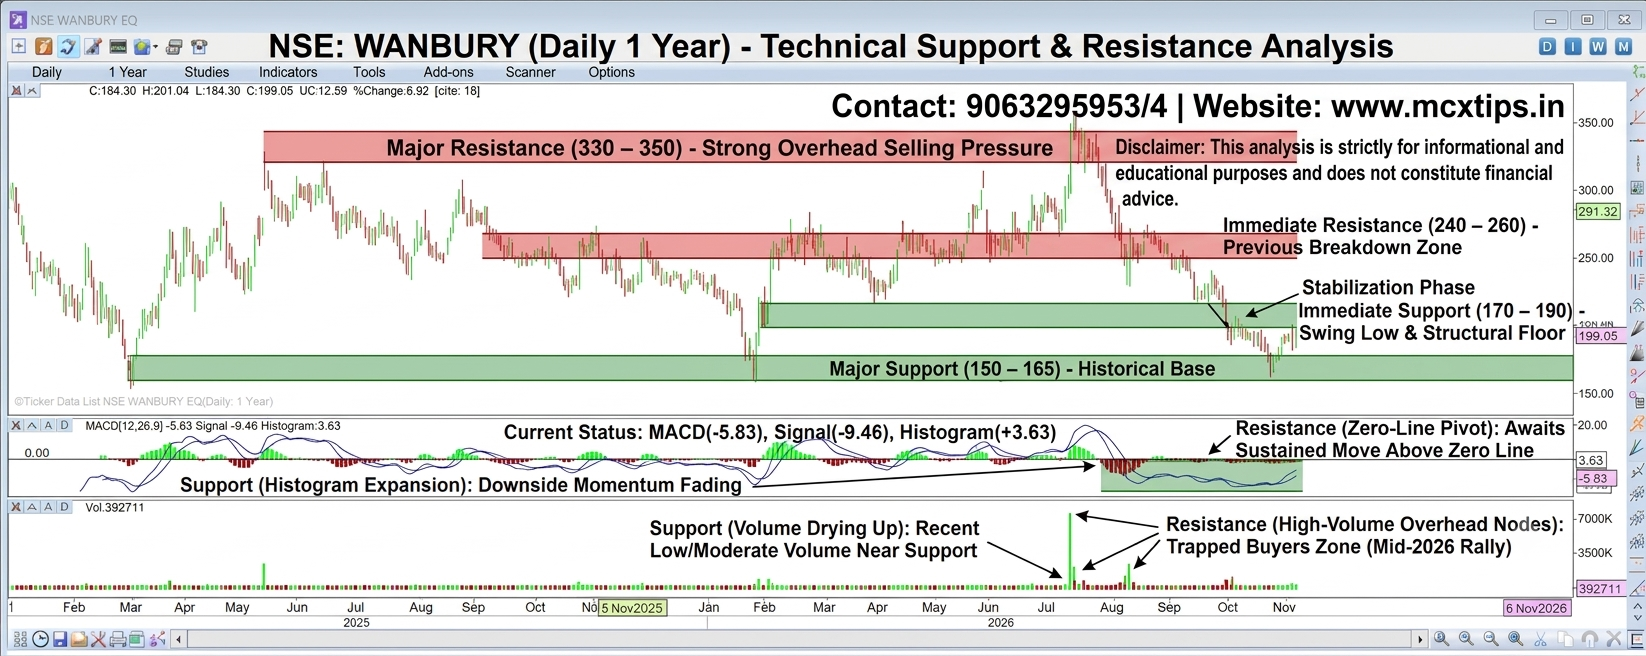
- Current Trend: The stock is currently stabilizing near the lower end of its 1-year range around 199.05, following a sharp corrective phase from its mid-2026 peak near 350.00.
- Support Levels:
- Immediate Support ($170 – 190$): Aligns with the recent swing low and structural floor formed in late 2025/early 2026.
- Major Support ($150 – 165$): Historical base and psychological multi-month swing low zone.
- Resistance Levels:
- Immediate Resistance ($240 – 260$): Intermediate consolidation zone and previous breakdown area.
- Major Resistance ($330 – 350$): The 52-week high supply zone representing strong overhead selling pressure from the mid-2026 rally.
2. MACD Indicator (Moving Average Convergence Divergence)
- Setting: MACD(12, 26, 9)
- Current Status: MACD line is at -5.83, Signal line at -9.46, with a positive histogram reading of +3.63, showing early signs of bullish momentum recovery after a deep corrective cycle.
- Support / Zero-Line Dynamics:
- Support (Histogram Expansion): The positive histogram tick above the signal line indicates that downside selling momentum is actively fading.
- Resistance (Zero-Line Pivot): The 0.00 baseline acts as major overhead momentum resistance. A sustained move above the zero line is needed to confirm a broader trend reversal.
3. Volume Indicator
- Setting: Daily Volume (Latest: 392,711)
- Support / Resistance via Volume:
- Support (Volume Drying Up): Recent low-to-moderate volume consolidation near current support suggests that aggressive selling pressure is drying up.
- Resistance (High-Volume Overhead Nodes): Massive volume spikes observed during the mid-2026 peak indicate heavy overhead supply where buyers became trapped, acting as crucial resistance on any relief rally