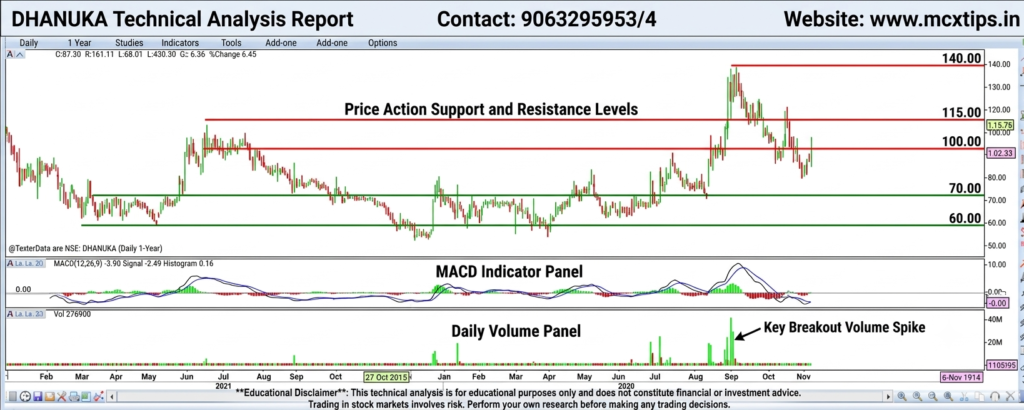





NSE: DHANUKA (Dhanuka Agritech Ltd.) based on the 1-year daily chart provided
1. Price Action (Main Chart)
- Current Trend: The stock is currently consolidating/recovering following a corrective pullback from its multi-month highs near 140–150 (set around mid-2026), hovering around 103.93.
- Support Levels:
- Immediate Support ($90 – 95$): Aligns with the recent swing low and minor consolidation floor.
- Major Support ($70 – 80$): Historical structural base established during prior multi-month lows.
- Resistance Levels:
- Immediate Resistance ($120 – 125$): Intermediate breakdown zone and recent lower-high barrier.
- Major Resistance ($140 – 150$): 52-week peak supply zone representing heavy overhead selling pressure from the mid-2026 rally.
2. MACD Indicator (Moving Average Convergence Divergence)
- Setting: MACD(12, 26, 9)
- Current Status: MACD line is at -3.90, Signal line at -3.48, with a small histogram reading of -0.42, indicating mild ongoing consolidation or slight downward momentum.
- Support / Zero-Line Dynamics:
- Support (Base Pivots): The region below the signal lines acts as a momentum stabilization floor where selling pressure typically begins to decelerate.
- Resistance (Zero-Line Pivot): The 0.00 baseline serves as major overhead momentum resistance. A bullish crossover above the signal line and a sustained push back above the zero line are required to confirm trend acceleration.