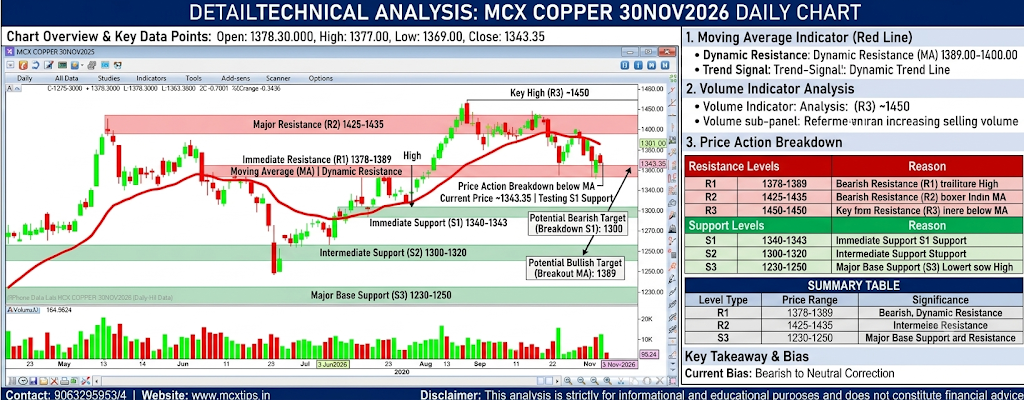





Chart Overview & Key Data Points
- Contract: MCX COPPER (Expiry 30-Nov-2026)
- Timeframe: Daily
- Latest Candle Price Metrics:
- Open (O): ~1373.00
- High (H): ~1378.00
- Low (L): ~1343.00
- Close (C): ~1343.35
- Change (%): -0.49% to -0.70% (Recent red bearish candle closing near the day’s low)
- Moving Average Indicator (Red Dynamic Trendline)
The main panel features a continuous red trendline representing a Moving Average (likely a 20-period or 50-period SMA/EMA).
- Dynamic Resistance: Price has recently broken below the moving average line (which sits at approximately 1389.00 – 1400.00). This line now acts as the immediate dynamic resistance ceiling. Any pullback toward this moving average will face selling pressure.
- Trend Signal: The slope of the moving average has flattened from its prior upward trend and is beginning to curve downward, confirming short-term bearish momentum.
2. Volume Indicator Analysis (Lower Sub-panel)
The bottom pane shows daily Volume bars (Current Volume ~9524).
- Selling Volume Spike: Recent red (bearish) volume bars have expanded compared to green (bullish) volume bars during the late October and early November swings.
- Support/Resistance Implication: The increased volume on downward moves confirms strong conviction from sellers near the 1420.00 – 1430.00 resistance area. Without significant green buying volume returning, support levels are more vulnerable to breakdown.
3. Price Action Support & Resistance Breakdown
Resistance Levels (Ceiling / Overhead Supply)
- Immediate Resistance (R1): 1378.00 – 1389.00
- Reason: The recent candle’s High (~1378.00) and the dynamic Red Moving Average line (~1389.00).
- Major Resistance (R2): 1425.00 – 1435.00
- Reason: Multiple swing highs created in late September, October, and early November formed a strong supply zone around 1425–1435 before the recent sell-off.
- Key All-Time/Swing High (R3): ~1450.00
- Reason: Major structural high peak established earlier in the chart move.
Support Levels (Floor / Buyer Demand)
- Immediate Support (S1): 1340.00 – 1343.00
- Reason: Current daily low (~1343.00) and the swing low established in late October.
- Intermediate Support (S2): 1300.00 – 1320.00
- Reason: Prior horizontal breakout zone from late July/early August where price consolidated before making its rally upward.
- Major Base Support (S3): 1230.00 – 1250.00
- Reason: The major swing low from July 2026 (marked by the vertical spike down to ~1230–1240).
Summary Table
Level TypePrice Range (MCX INR)Key SignificanceMajor Resistance (R2)1425.00 – 1435.00Recent double-top / multi-swing supply cluster.
Dynamic Resistance (R1)1389.00Moving Average Line overhead.
Current Price~1343.35Testing low of the day near short-term support.
Immediate Support (S1)1340.00 – 1343.00October swing low floor.
Major Support (S2)1300.00 – 1315.00Historical consolidation base.
Key Takeaway & Bias
- Current Bias: Bearish to Neutral Correction.
- Key Setup: Price is currently retesting immediate support around 1340–1343. A breakdown below 1340 on high volume open interest could push price toward 1300. A reversal above 1389 (moving average) is required to restore bullish structure
Contact: 9063295953/4 | Website: www.mcxtips.in
- Disclaimer: This analysis is strictly for informational and educational purposes and does not constitute financial advice.