





Market Direction
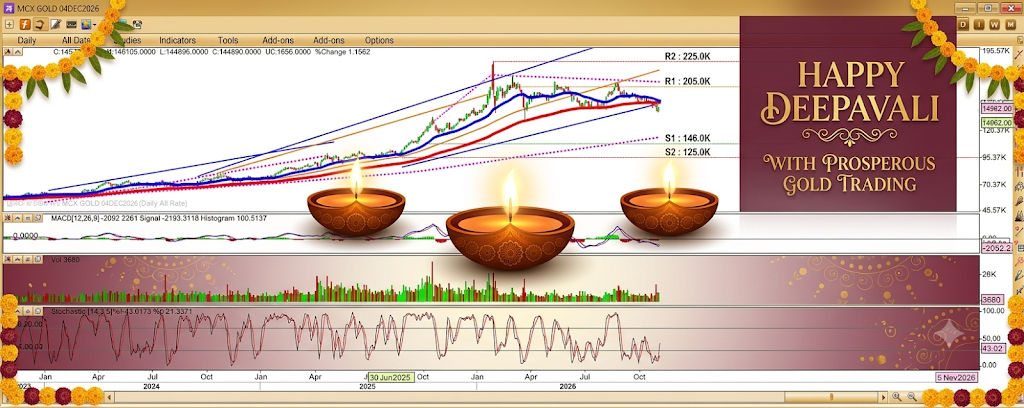
- Medium-to-Long Term: Bullish. The multi-year structure reveals a powerful, sustained macro uptrend originating from the 2023–2024 lows, characterized by a well-defined sequence of higher highs and higher lows riding strongly above the rising moving averages.
- Short-Term: Consolidative to Corrective. Following the aggressive upward expansion and a subsequent multi-month peak formation, the price action has entered a controlled pullback phase, currently trading near 144,890.00 as it consolidates right above the primary trend boundaries.
Support & Resistance Analysis
| Level Type | Price Range / Zone | Description & Significance |
| Major Resistance (R2) | 170,000 – 175,000 | Upper multi-year structural peak and major psychological supply ceiling. |
| Intermediate Resistance (R1) | 155,000 – 160,000 | Recent swing high barrier and previous rejection ceiling from prior sessions. |
| Current Price / Pivot | 144,890.00 | The immediate market equilibrium point during the current consolidation phase. |
| Immediate Support (S1) | 132,088 – 135,000 | Critical short-term demand floor aligning with recent consolidation lows and dynamic moving average support. |
| Major Support (S2) | 115,000 – 120,000 | Deep structural baseline established during prior major correction zones. |
Indicator Analysis
1. Price Action (Daily Candles & Moving Average)
- Observation: The price action displays an extensive macro advance followed by a recent flattening phase where candles fluctuate closely around the moving average lines (blue and red curves) near 144,890.00.
- Interpretation: The primary uptrend remains structurally sound, but the flattening price action indicates a cooling period and a digestion of prior gains before any decisive breakout or breakdown occurs.
2. MACD Sub-Panel [12,26,9]
- Observation: The MACD indicator displays a value of -2092.82, with the signal line at -2193.34 and a positive histogram reading of 100.51.
- Interpretation: The MACD and signal lines are positioned near the zero baseline, while the positive histogram reflects stabilizing short-term momentum following the recent cooling phase.
3. Volume Sub-Panel
- Observation: Volume levels show prominent spikes during heavy historical accumulation phases, whereas recent daily activity exhibits more subdued, average participation during the consolidation.
- Interpretation: Heavy volume validation during prior rallies indicates strong institutional sponsorship, while lighter volume on the current pullback signals a lack of aggressive liquidation or panic selling.
4. Stochastic Sub-Panel [14,3,5]
- Observation: The Stochastic oscillator shows $\%K$ at 43.02 and $\%D$ at 21.35, positioned in the lower-middle half of the range and curling upward from near-oversold levels.
- Interpretation: Momentum is bottoming out and turning upward from lower thresholds, suggesting building buying pressure that could support a recovery toward resistance zones.
Contact: 9063295953/4 | Website: www.mcxtips.in
Disclaimer: This analysis is strictly for informational and educational purposes and does not constitute financial advice.