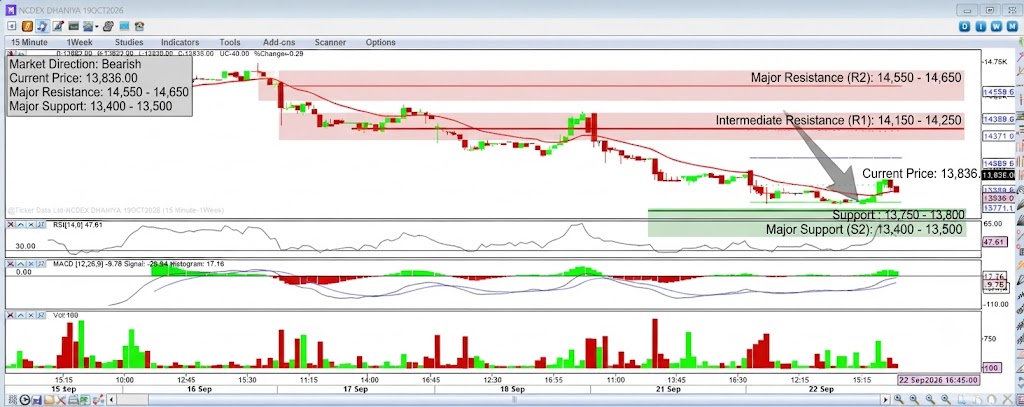


Based on the technical analysis chart for NCDEX DHANIYA (19OCT2026) on a 15-minute timeframe, here is a breakdown of the market direction, key support and resistance levels, and indicator interpretations:
Market Direction
- Short-Term: Bearish. The price action shows a clear sequence of lower highs and lower lows. The price is currently trading below its short-term moving average, indicating sustained selling pressure.
- Medium-to-Long Term: Neutral-to-Bearish. The broader trend shown on the chart has been a consistent decline from the peaks established on September 15th. While recent candles show a small attempt to stabilize, the overall structure remains down.
Support & Resistance Levels
| Level Type | Price Range / Zone | Description & Significance |
| Major Resistance (R2) | ~14,550 – 14,650 | A significant historical supply zone from previous highs. |
| Intermediate Resistance (R1) | ~14,150 – 14,250 | A recent lower-high corrective ceiling. |
| Current Price / Pivot | 13,836.00 | The immediate market equilibrium point. The price is hovering just above a minor support area. |
| Immediate Support (S1) | ~13,750 – 13,800 | A critical short-term demand zone corresponding to recent swing lows. |
| Major Support (S2) | ~13,400 – 13,500 | A deeper structural base established in early September. |
Indicator Analysis
1. Price Action (Candlesticks & Moving Average)
- Observation: The candles show a dominant bearish trend, with a large gap down followed by lower prices. The current price is struggling to stay above the 13,771.60 level and remains well below the red moving average line.
- Interpretation: The price action confirms the bearish bias. Buyers are weak, and every minor rally is being met with selling pressure. The moving average is a dynamic resistance level.
2. Volume (Sub-panel 1)
- Observation: Volume levels have been erratic. There was a significant spike in volume accompanying the major price drop, and sell-side volume has been dominant during recent minor retracements.
- Interpretation: The heavy volume during the decline confirms strong institutional interest on the short side. The lack of substantial buy-side volume suggests that the current stabilization is due to a lack of sellers rather than genuine accumulation.
3. MACD [12,26,9] (Sub-panel 2)
- Observation: The MACD line (blue) is well below the signal line (grey), and both are deep into negative territory, below the zero baseline. The histogram (green bars) is currently positive but very small, indicating a slight loss of downward momentum but not an outright bullish signal.
- Interpretation: This is a strong, sustained bearish signal. The fact that both lines are below zero confirms the overall trend is solidly down. The flat histogram suggests the immediate, sharp decline has paused, but the trend remains negative.
4. RSI [14,0] (Sub-panel 3)
- Observation: The Relative Strength Index is at 47.61. This is slightly below the neutral 50 line.
- Interpretation: The RSI is in a neutral zone but has a slight bearish tilt. It does not indicate that the market is oversold, which leaves room for the price to continue to drift lower without a major technical bounce.
Conclusion
The overall picture for NCDEX DHANIYA is bearish. The price action, MACD, and moving average all confirm a sustainable downtrend with strong seller control. While the RSI is neutral and the MACD histogram shows minor positive divergence (indicating the immediate, sharp drop has paused), the price is still making lower lows. The key to the next major move will be a confirmed break either below S1 (which could trigger a test of S2) or above R1 (which could signal a shallow relief rally).