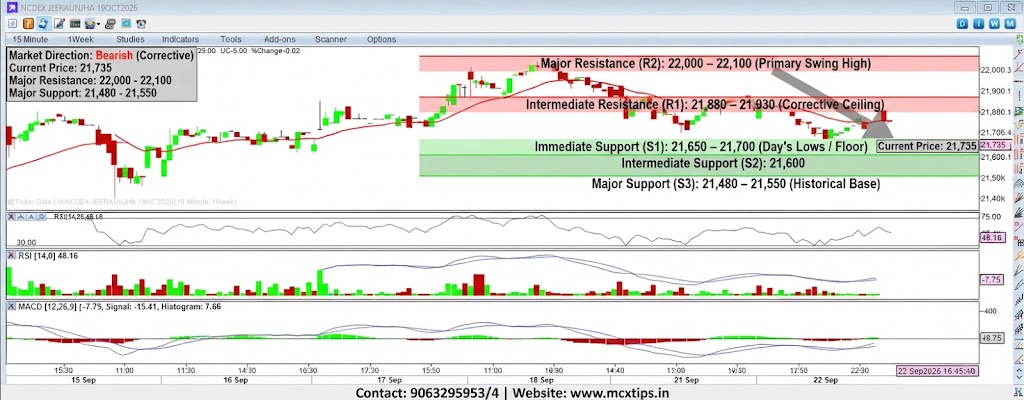


Based on the technical analysis of the provided NCDEX JEERAUNJHA (19OCT2026) 15-minute chart, here is the breakdown of the market direction and key support/resistance levels:
Market Direction
- Short-Term: Bearish / Corrective
- Market Status: The chart shows a clear short-term downtrend. After failing to sustain a rally that peaked near the 22,100 zone, the price has formed a sequence of lower highs and lower lows. It is currently trading near its session lows at 21,735 and has broken below its short-term moving average, indicating sustained selling pressure.
Support & Resistance Levels
| Level Type | Price Zone / Point | Significance |
| Major Resistance (R2) | 22,000 – 22,100 | The major psychological round number and the primary swing high from which the current corrective wave originated. |
| Intermediate Resistance (R1) | 21,880 – 21,930 | A recent minor swing high and the current corrective ceiling. |
| Current Price / Pivot | 21,735 | The immediate market equilibrium point. The price is hovering just above the first major support level. |
| Immediate Support (S1) | 21,650 – 21,700 | A critical short-term demand zone corresponding to the day’s lows and a consolidation floor. A break below this level could accelerate the decline. |
| Intermediate Support (S2) | 21,600 | A minor psychological and intraday structural level. |
| Major Support (S3) | 21,480 – 21,550 | A significant historical base established before the last major upward expansion. |
Disclaimer: This analysis is strictly for informational purposes and does not constitute financial advice.