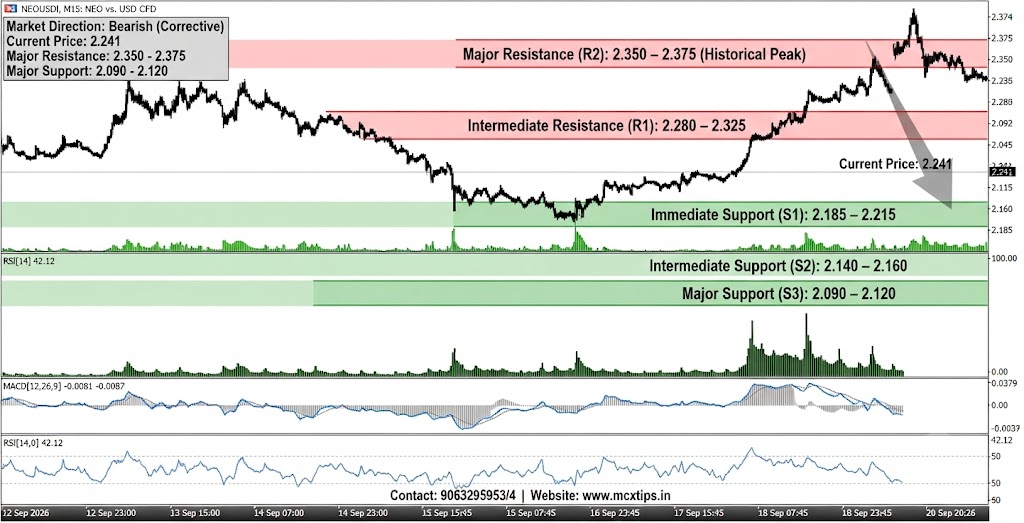



Based on the technical analysis of the provided NEOUSD! (NEO vs. USD CFD) 15-minute timeframe chart, here is the breakdown of the market direction and key support and resistance zones:
Market Direction
- Short-Term: Bearish / Corrective[cite: 2]
- Market Status: Following a strong impulsive rally to multi-day highs near the $2.374 region, the price action has experienced a sharp rejection and entered a corrective pullback. The price is currently trading around the $2.241 level, reflecting dominant short-term selling momentum and profit-taking[cite: 2].
Support & Resistance Levels
| Level Type | Price Zone / Point | Significance |
| Major Resistance (R2) | ~2.350 – 2.375 | The major multi-session peak and psychological ceiling[cite: 2]. A sustained break above this zone is required to resume the broader upward trend. |
| Intermediate Resistance (R1) | ~2.280 – 2.325 | The immediate overhead barrier and recent swing high where aggressive selling pressure previously emerged[cite: 2]. |
| Current Price / Pivot | 2.241 | The immediate market equilibrium point where the asset is attempting to stabilize during the correction[cite: 2]. |
| Immediate Support (S1) | ~2.185 – 2.215 | The first notable short-term demand zone acting as a buffer against further downward extension. |
| Intermediate Support (S2) | ~2.140 – 2.160 | A stronger technical floor corresponding to prior consolidation structures and lower swing bases[cite: 2]. |
| Major Support (S3) | ~2.090 – 2.120 | The deep structural baseline established prior to the major bullish expansion leg[cite: 2]. |
Indicator Summary
- Price Action: Consecutive red corrective candles showing a sharp impulsive pullback from upper highs down toward the $2.241 area, signaling strong short-term distribution[cite: 2].
- RSI (14): Hovering around 42.12, positioned below the neutral 50 line[cite: 2]. This reflects prevailing downside momentum, though it is not yet technically oversold, suggesting the correction could continue[cite: 2].
- MACD: The MACD line remains positioned below the signal line with an expanding negative histogram (reading -0.0081 / -0.0087)[cite: 2], validating that short-term momentum favors sellers during this retracement phase[cite: 2].
Contact: +919063295953/4 | Website: www.mcxtips.in
Disclaimer: This analysis is strictly for informational and educational purposes and does not constitute financial advice.