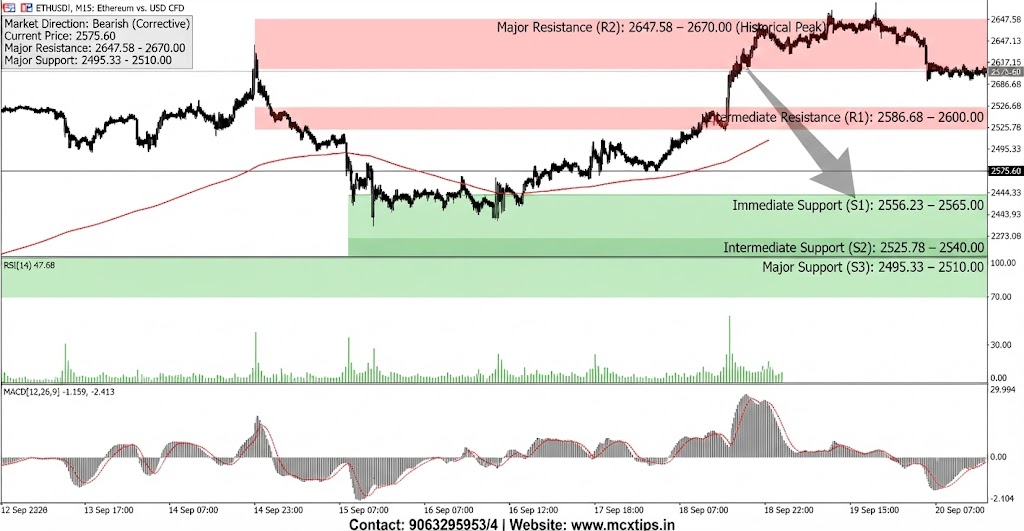



Based on the technical analysis chart for ETHUSD! (Ethereum vs. USD CFD) on the M15 timeframe, here is a breakdown of the market direction, key support and resistance levels, and an analysis of the indicators.
Market Direction
- Short-Term: Bearish / Corrective. After reaching a recent high near 2647.58[cite: 2], the price action has formed a series of lower highs and lower lows on the M15 chart[cite: 2]. The current price of 2575.60 is attempting to stabilize but remains under selling pressure, trading below the 50-period moving average (red line) and hugging the lower Bollinger Band[cite: 2]. This indicates short-term bearish momentum is dominant[cite: 2].
- Medium-Term (Macro Context): Bullish. While the M15 timeframe shows a correction, the broader chart (partially visible on the left) suggests an established macro uptrend originating from lower levels. The recent peak was a significant multi-day high, and the current move is a pullback or consolidation phase within that larger structure.
Support & Resistance Levels
Based on the current M15 price action and swing points, Gemini provides the following key levels to watch:
| Level Type | Price Point / Zone | Significance |
| Resistance 2 (Major) | ~2647.58 – 2670.00 | The major multi-session peak and ultimate supply ceiling from the recent rally[cite: 2]. |
| Resistance 1 (Intermediate) | ~2586.68 – 2600.00 | The immediate overhead barrier and recent local swing high where selling pressure previously emerged[cite: 2]. |
| Current Price / Pivot | 2575.60 | The immediate market equilibrium point where the price is currently battling to consolidate after the latest leg down[cite: 2]. |
| Immediate Support (S1) | ~2556.23 – 2565.00 | The first critical short-term demand zone, aligning with prior consolidation lows and the current lower Bollinger Band boundary[cite: 2]. |
| Intermediate Support (S2) | ~2525.78 – 2540.00 | A deeper structural base established during the prior phase of the rally[cite: 2]. |
| Major Support (S3) | ~2495.33 – 2510.00 | The major swing low and significant psychological floor. A break below here would signal a potential acceleration of the correction[cite: 2]. |
Indicator Analysis
- Price Action (Candlesticks & Moving Average [MA]):
- Observation: The M15 candles show a clear recent downtrend originating from the 2647.58 high, characterized by a predominance of red bars and dominant selling pressure[cite: 2]. The price has recently fallen below the central Bollinger Band and is currently testing the lower bounds of the bands[cite: 2]. The red moving average line is sloping downward and acting as dynamic resistance.
- Interpretation: This confirms the short-term bearish momentum. The price is now in a distribution phase within the lower range, suggesting selling pressure remains dominant on any bounce unless a confirmed breakout above the moving average occurs.
- Volume (Sub-Panel 1 – Green/Red Bars):
- Observation: Volume levels have spiked distinctly during the major downward price expansion phases (the recent sell-offs), signaling capitulation and strong institutional selling. Current volume on minor consolidations is lower[cite: 2].
- Interpretation: Heavy volume validation during historical downward pushes confirms genuine institutional selling interest. Subdued volume on minor pullbacks suggests a lack of significant buying conviction, supporting the view that the primary short-term trend remains under the control of sellers.
- Relative Strength Index (RSI [14,0]) (Sub-Panel 2):
- Observation: The RSI on the M15 chart is currently hovering near 47.68, well below the neutral 50 mark and trending slightly downward[cite: 2]. It is not technically oversold (below 30).
- Interpretation: The RSI confirms the strength of the current bearish momentum. It suggests the market has room to fall further before it hits extreme oversold levels that might trigger a deeper counter-trend correction.
- Moving Average Convergence Divergence (MACD [12,26,9]) (Sub-Panel 3):
- Observation: The MACD line (blue) is well below the Signal line (grey), and both are positioned significantly below the zero baseline. The Histogram (green/red bars) oscillates but maintains a clear negative bias, reflecting accelerating downward momentum during major sell-offs[cite: 2]. The current reading is (-1.159) – (-2.413).
- Interpretation: This is a strong, sustained bearish signal on the M15 timeframe. It confirms that negative momentum is dominant and that the downtrend has not yet run its course. The MACD remains deeply oversold, which is typical of a strong short-term downtrend, and is not yet providing a convincing signal of a bottom.
Conclusion
The overall picture for ETHUSD (Ethereum) on the M15 timeframe is strongly bearish across almost all visible technical indicators. The price action, MACD, RSI, and Volume all point to powerful, accelerating downward momentum. The immediate target is the Support 1 zone, and a breakdown below that would open the path toward Support 2. Resistance at Resistance 1 is now a critical ceiling for maintaining this bearish structure, and any rally to that level is likely to be met with renewed selling pressure.
Disclaimer: This analysis is strictly for informational and educational purposes and does not constitute financial advice.
Contact: +919063295953/4 whats app | Website: www.mcxtips.in