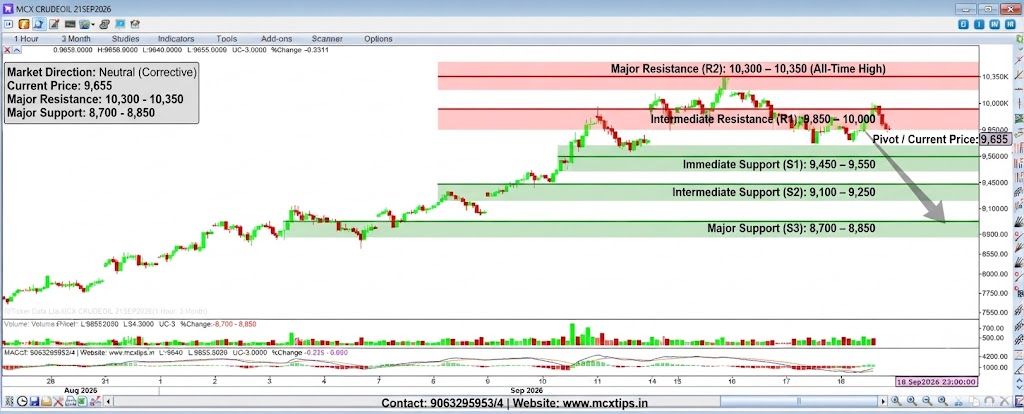



Based on the technical analysis chart for MCX CRUDEOIL 21SEP2026 (1-Hour timeframe, 3-Month view), here is a breakdown of the market direction and support/resistance levels.
Market Direction
- Medium-to-Long Term: Bullish. The chart shows a clear, sustained macro uptrend originating from lows near 7600K in early August, culminating in the recent peak of 10329K. The price has formed a series of higher highs and higher lows, establishing a strong primary trend.
- Short Term: Neutral to Corrective. Following the major peak, the price has experienced a sharp, impulsive pullback to around 9655K. This is a significant retracement, indicating a period of consolidation or a healthy correction within the broader uptrend. The recent candles show volatility and indecision, suggesting the market is finding equilibrium.
Support & Resistance Analysis
| Level Type | Price (K) | Description & Technical Significance |
| Major Resistance (R2) | ~10,300 – 10,350 | The all-time high and significant psychological round number. This is the ultimate supply ceiling that must be broken to continue the long-term rally. |
| Intermediate Resistance (R1) | ~9,850 – 10,000 | A recent corrective lower high and intermediate barrier, aligning with a prior consolidation zone. This is the first level buyers need to overcome to regain short-term momentum. |
| Pivot / Current Price | 9,655 | The immediate price point where the market is battling following the recent drop. It serves as the current equilibrium level. |
| Immediate Support (S1) | ~9,450 – 9,550 | A critical short-term structural floor, corresponding to recent swing lows and the top of the last major consolidation phase. Holding above this is essential for buyers to maintain the integrity of the current structure. |
| Intermediate Support (S2) | ~9,100 – 9,250 | Previous major consolidation area and a strong historical pivot base established in late August. A break below this would signal a deeper correction. |
| Major Support (S3) | ~8,700 – 8,850 | The major swing low and a key baseline floor from mid-August. A break below this would indicate a significant trend reversal. |
Price Action Interpretation
- Observation: After the strong impulsive rally to 10329K, the price action has become choppy and volatile, with the most recent move being a steep, impulsive drop characterized by a series of red candles. The price is now battling at the 9655K level.
- Interpretation: This confirms that the immediate bullish momentum has stalled, and the market has entered a consolidation or correction phase. The heavy accumulation during the uptrend is a positive long-term sign, but the recent retracement indicates sellers have a strong short-term presence. The price is currently testing the upper bounds of its prior trading range. Buyers need to hold the price above S1 (9450-9550) to prevent a deeper retracement toward S2 (9100-9250).
Disclaimer: This analysis is for informational purposes only and does not constitute financial advice.