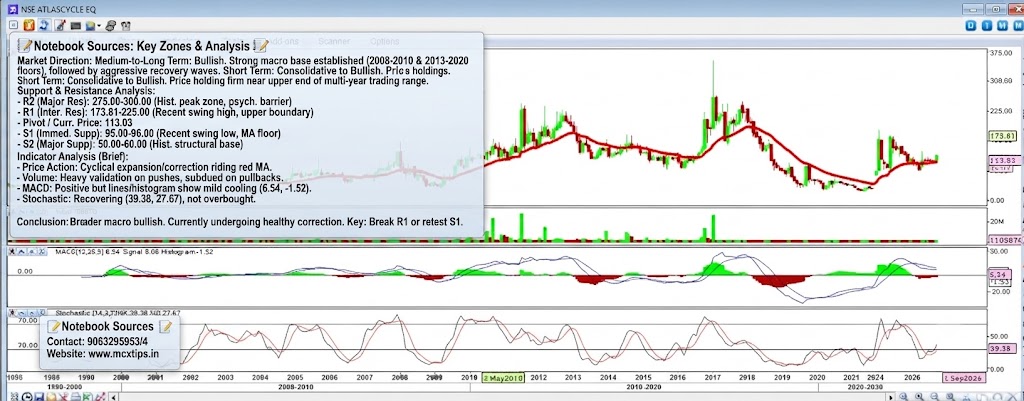



NSE ATLASCYCLE EQ.
Market Direction
- Medium-to-Long Term: Bullish. The monthly chart displays a strong macro base established during the 2008–2010 period and reinforced by the extended consolidation floor between 2013 and 2020. This base has been followed by aggressive, impulsive recovery waves.
- Short Term: Neutral-to-Bullish. Following a significant upward expansion to recent highs, the price is currently experiencing a healthy multi-month correction or consolidation, holding firm near the upper end of its multi-year trading range.
Support & Resistance Analysis
| Level Type | Price Range / Zone | Description & Significance |
| Major Resistance (R2) | 275.00 – 300.00 | Historical major peak zone and significant psychological barrier from previous macro highs. |
| Intermediate Resistance (R1) | 173.81 – 225.00 | Recent swing high ceiling (as marked on the right axis) and upper technical boundary. |
| Current Price / Pivot | 113.03 | The immediate market equilibrium point on the monthly chart. |
| Immediate Support (S1) | 95.00 – 96.00 | A confluence of the recent monthly swing low and dynamic support from the 50-period moving average. |
| Major Support (S2) | 50.00 – 60.00 | Historical structural base formed during the prior long-term consolidation cycles (pre-2020). |
Indicator Analysis
1. Price Action (Monthly Candles & Moving Average)
- Observation: The chart displays a cyclical pattern of alternating long green and red candles riding along a dynamic moving average line (red curve). The price is currently trading near 113.03, having pulled back from higher levels near R1.
- Interpretation: The price action highlights cyclical expansion followed by healthy corrections, keeping the macro bullish structure intact without a severe structural breakdown.
2. Volume Sub-Panel
- Observation: Volume bars show periodic, significant spikes during macro price surges, indicating institutional accumulation. There is notably lower relative volume during quieter consolidation phases.
- Interpretation: Heavy volume validation during historical upward pushes confirms genuine buying interest, while subdued volume on pullbacks indicates an absence of heavy liquidation or panic selling.
3. MACD Sub-Panel [12,26,9]
- Observation: The MACD indicator reads a positive value of 6.54, but the MACD line is now below the signal line (which is at 8.06), and the histogram is negative at -1.52.
- Interpretation: This is a standard signal for a mild short-term cooling period or consolidation phase. Despite the recent pullback, the fact that the MACD lines remain above the zero baseline confirms that the broader macro environment remains bullish.
4. Stochastic Sub-Panel [14,3,5]
- Observation: The Stochastic oscillator shows $\%K$ at 39.38 and $\%D$ at 27.67. The lines are positioned in the lower-middle half of the range and are currently curling upward.
- Interpretation: The indicator is recovering from lower levels and is not yet overbought. This points toward building upward momentum that could support the next leg up once the current consolidation concludes.
Conclusion
The overall picture for NSE ATLASCYCLE EQ on the monthly timeframe is bullish. It is currently undergoing a normal, healthy correction within a larger upward trend. Traders would watch for either a confirmed breakout above R1 to resume the primary uptrend or a potential retest of S1 as a buying opportunity, provided that major support at S2 holds.