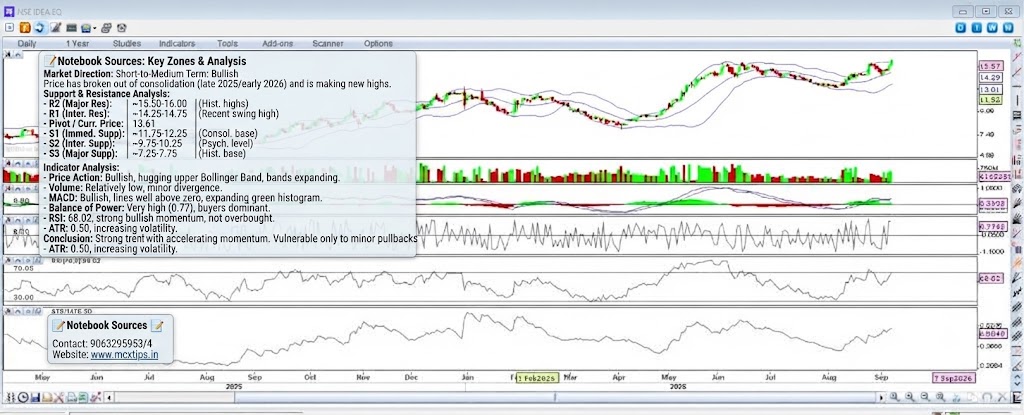



Based on the technical analysis chart for NSE IDEA.EQ (Daily, 1 Year), here is a detailed breakdown of support and resistance levels and a comprehensive analysis of every visible indicator.
Market Direction
- Medium-to-Long Term: Bullish. The price action shows a clear upward trend originating from lows near 5.00 in early 2025, culminating in recent highs around 13.00-13.50.
- Short Term: Strongly Bullish. The price has recently broken out of a consolidation phase (late 2025/early 2026) and is making new highs within the broader uptrend, trading in the upper half of its Bollinger Bands.
Support & Resistance Analysis
| Level Type | Price Range | Significance |
| Major Resistance (R2) | ~15.50 – 16.00 | Historical major supply zone from previous multi-year highs. |
| Intermediate Resistance (R1) | ~14.25 – 14.75 | Recent swing high just above the current price action. |
| Current Price / Pivot | 13.61 | The immediate market equilibrium point, confirming the breakout. |
| Immediate Support (S1) | ~11.75 – 12.25 | The most recent consolidation base and top of the previous trading range. |
| Intermediate Support (S2) | ~9.75 – 10.25 | Psychological round number and previous area of price interaction. |
| Major Support (S3) | ~7.25 – 7.75 | A long-term historical base formed throughout mid-2025. |
Indicator Analysis
1. Price Action (Candlesticks & Bollinger Bands®)
- Observation: The candles show a powerful, impulsive rally with mostly green bars. The price is currently hugging the upper Bollinger Band and has caused the bands to expand outward.
- Interpretation: This confirms strong bullish momentum and the start of a new volatile uptrend phase. The bands widening indicates increasing volatility accompanying the price rise.
2. Volume (Sub-panel 1)
- Observation: The volume bars are relatively low and erratic. While there were some moderate spikes during the initial rally phase in mid-2025, current volume is not exceptionally high relative to the past year.
- Interpretation: This is a slightly concerning divergence. A powerful breakout to new highs should ideally be confirmed by heavy accumulation (high volume). The current lack of volume suggests the move may be vulnerable to a pullback due to a lack of deep conviction, despite the strong price action.
3. MACD [12,26,9] (Sub-panel 2)
- Observation: The MACD line (blue) is well above the Signal line (grey), and both are significantly above the zero baseline. The Histogram (green bars) is positive and expanding upward, with a current reading of 0.09.
- Interpretation: This is a very bullish signal. It indicates strong and accelerating upward momentum. The fact that the lines are above zero confirms the overall trend is solidly bullish.
4. Balance of Power (Sub-panel 3)
- Observation: This indicator is oscillating wildly, but it has a positive bias and is currently high at 0.77.
- Interpretation: A reading of 0.77 is very strong, indicating that buyers are in absolute control and have been aggressively pushing the price higher, especially in the most recent sessions.
5. RSI [14,0] (Sub-panel 4)
- Observation: The Relative Strength Index is at 68.02. This is just under the traditional 70.00 “overbought” threshold.
- Interpretation: The RSI reflects strong bullish momentum without yet being technically overbought. The market has room to run before it hits extreme levels, suggesting the trend is still healthy.
6. ATR [14] (Sub-panel 5)
- Observation: The Average True Range is currently moderate at 0.50, showing a slight increase from its lows earlier in the year.
- Interpretation: This confirms the Bollinger Band analysis—volatility is increasing. The market is making larger daily moves, which is typical for a breakout.
Conclusion
The chart for NSE IDEA.EQ is fundamentally bullish across almost all indicators. The price action, MACD, RSI, Balance of Power, and Bollinger Bands all point to strong, accelerating upward momentum. The only minor caveat is the relatively lackluster volume accompanying the breakout, which traders should monitor for potential weakness. The next major target is R1, followed by the long-term historical resistance at R2, provided the price can maintain its current trajectory above S1.