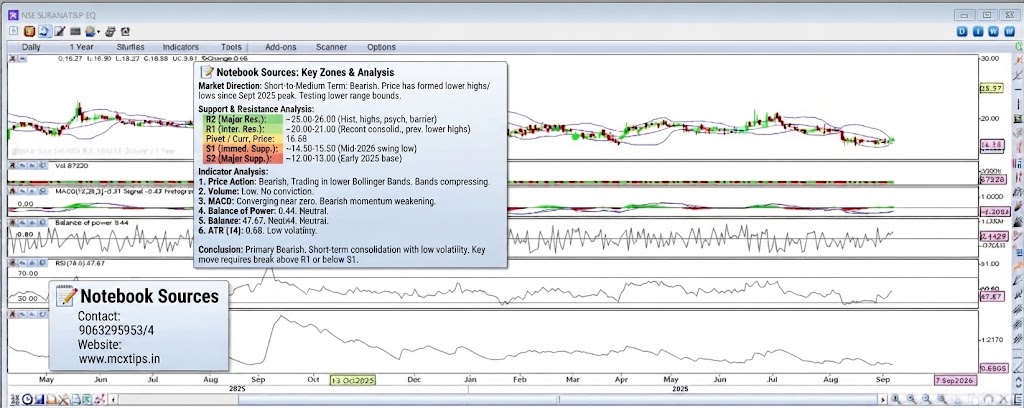



Based on the technical analysis chart for NSE SURANAT&P EQ (Daily, 1 Year), here is a detailed analysis of support and resistance levels, along with a breakdown of every visible indicator.
Market Direction
- Short-to-Medium Term: Bearish. The price action has formed a clear sequence of lower highs and lower lows following the major spike in September 2025. The recent price is testing the lower bounds of its established range.
Support & Resistance Analysis
| Level Type | Price Range | Significance |
| Major Resistance (R2) | ~25.00 – 26.00 | Historical zone of previous highs and a significant psychological barrier. |
| Intermediate Resistance (R1) | ~20.00 – 21.00 | Recent consolidation level and area of previous lower highs. |
| Current Price / Pivot | 16.58 | The immediate market equilibrium point. |
| Immediate Support (S1) | ~14.50 – 15.50 | The most recent major swing low established in mid-2026. |
| Major Support (S2) | ~12.00 – 13.00 | A long-term historical support base from early 2025. |
Indicator Analysis
1. Price Action (Candlesticks & Bollinger Bands®)
- Observation: The candles show a prolonged downtrend from the peak. The price is currently trading in the lower half of the Bollinger Bands, and the bands themselves are showing signs of compression, suggesting a potential upcoming increase in volatility.
- Interpretation: The bearish momentum is dominant, with the price repeatedly failing to rally above intermediate resistance levels.
2. Volume (Sub-panel 1)
- Observation: Volume is low and lacks significant spikes, especially during the current sideways consolidation phase.
- Interpretation: This indicates a lack of strong conviction from either buyers or sellers at current levels. The market is relatively quiet.
3. MACD [12,26,9] (Sub-panel 2)
- Observation: The MACD line is below the signal line, and the histogram is negative, but both are very close to the zero line and appear to be converging.
- Interpretation: This signals a weakening of the immediate bearish momentum. While the trend is still down, the selling pressure has subsided, and a period of neutrality or a mild relief rally is possible if the lines cross positively.
4. Balance of Power (Sub-panel 3)
- Observation: The indicator is oscillating erratically around the zero baseline with no clear directional bias. The current reading is 0.44, which is essentially neutral.
- Interpretation: There is no clear dominance by buyers or sellers; the market is in a tug-of-war.
5. RSI [14,0] (Sub-panel 4)
- Observation: The Relative Strength Index is at 47.67, which is squarely in the neutral zone (neither overbought nor oversold).
- Interpretation: The RSI confirms the sideways, consolidative nature of the current price action. It is not providing a strong buy or sell signal.
6. ATR [14] (Sub-panel 5)
- Observation: The Average True Range is currently low at 0.68, reflecting subdued daily price fluctuations.
- Interpretation: This confirms the low volatility environment suggested by the low volume and Bollinger Band compression. Traders should be prepared for a potential breakout from this tight range.
Conclusion
The chart is in a bearish primary trend but has entered a period of short-term consolidation with low volatility. The indicators are mixed, leaning slightly towards neutrality as bearish momentum fades without any immediate bullish catalysts appearing. The key to the next major move will be a confirmed break either below S1 (which could trigger a test of S2) or above R1 (which could signal a rally back towards R2).