





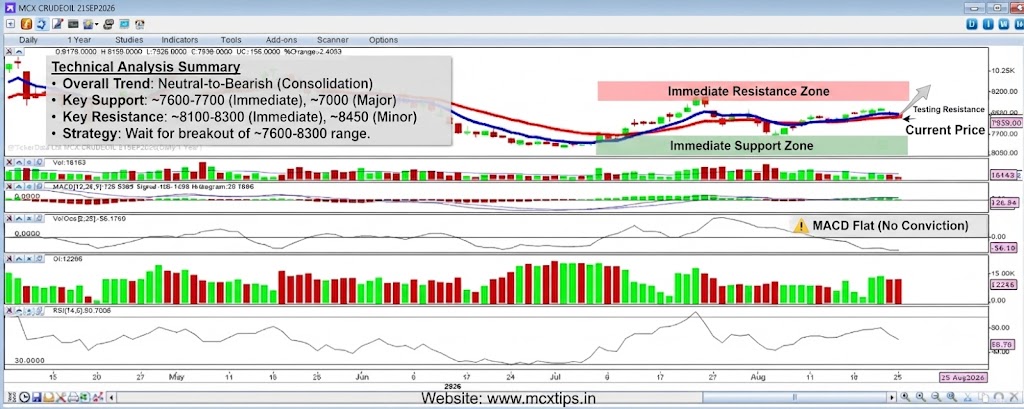
Based on the provided daily chart for MCX CRUDEOIL (expiring 21 SEP 2026), here is a technical analysis of the current direction, support, and resistance levels.
Overall Directional Bias
The short-to-medium term trend is Neutral-to-Bearish (Consolidation with a downward tilt).
- Price Action: The chart shows a distinct downward trend from May through July. Since late July, the price has been in a consolidation phase, trading within a tighter range between ~7600 and ~8300. The price is currently at 7939.00, after a recent pullback from the range highs.
- Moving Averages: The short-term (red) moving average is crossed below the long-term (blue) moving average, which is a bearish signal. However, the price is currently coiling near both averages, and they are beginning to flatten, indicating the strong bearish momentum has waned and the market is searching for direction.
- Indicators:
- MACD: The MACD line is hovering just above the signal line, and the histogram is nearly flat at the zero line. This reflects a lack of strong momentum in either direction, confirming the consolidation phase.
- RSI: The RSI is at 50.70, which is exactly in the “neutral” zone. It has been moving sideways, offering no clear signal of an impending breakout.
- Open Interest: Open interest has been decreasing during the recent consolidation, which often suggests that new positions are not being added and the current move lacks strong conviction.
Conclusion on Direction: The market is in a “wait-and-see” mode. The bias is slightly defensive as the price is below the moving averages, but the lack of strong momentum from the indicators suggests a breakout is needed to determine the next major trend.
Support Levels (Downside Targets)
These are key levels where buying interest is likely to emerge.
- Immediate Support: ~7600 – ~7700 This is the first and most crucial short-term support zone, representing the recent swing lows in late July and early August. A decisive break below this level would signal the resumption of the primary downtrend towards 7000.
- Major Support: ~7000 A major psychological round-number level and the site of the significant low from late July. This is a critical structural support floor for the medium term.
Resistance Levels (Upside Barriers)
These are key levels where selling pressure is likely to increase.
- Immediate Resistance: ~8100 – ~8300 This zone is the first major hurdle to the upside. It is where the moving averages are currently converging (around 8150) and also aligns with the recent swing highs in early August. A break and hold above this level is required to shift the bias to bullish and target higher levels.
- Minor Resistance: ~8450 – ~8500 Farther up, this level represents a previous consolidation area from late June, which will act as a secondary barrier against further upside.
Summary Strategy
- Neutral/Cautious: The market is in consolidation. Traders may want to avoid entering large positions until a clear breakout occurs from the current ~7600 – ~8300 range.
- Bulls (Waiting for strength): Wait for a confirmed daily close above the ~8300 resistance level before entering long positions. Your initial target would be 8450, with a tight stop-loss just below 8200.
- Bears (Playing the range): Could look for short entries on any bounce that fails near the 8150-8200 area (near the moving averages), with a tight stop-loss just above 8300 and an initial target of 7700. A break below ~7600 would be a more confirmed sell signal, targeting 7000.
Disclaimer: This technical analysis is for informational purposes only and does not constitute financial advice. Trading involves risk, including the loss of principal. Please conduct your own research or consult a professional financial advisor before making any trading decisions.
for more updates join our whatsapp group https://chat.whatsapp.com/Jrj3abV2S945BqYiQzOdk9