




Overall Directional Bias
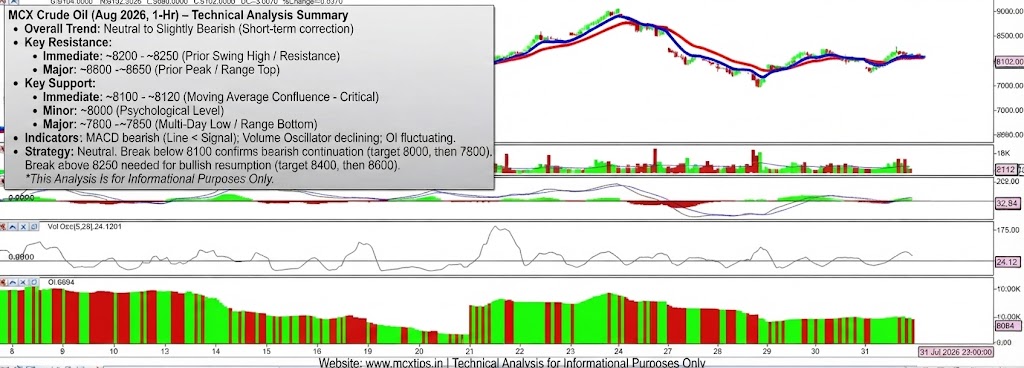
The overall trend is Neutral to Slightly Bearish in the short term, as the price is currently in a corrective phase following a significant rally.
- Price Action: After establishing a multi-day high near 8900, the price has experienced a steady pullback, forming a series of lower highs and lower lows. It is currently testing the 8100 level, which is a critical area of confluence.
- Moving Averages: The short-term (red) moving average is now below the long-term (blue) moving average, signaling a bearish crossover and confirming the short-term downward momentum.
- Indicators:
- MACD: The MACD line is below the signal line, and the histogram is negative, which supports the bearish bias.
- Volume Oscillator: The volume oscillator has been declining, indicating that the recent bearish moves are not supported by strong volume, which is common during a consolidation phase.
- OI (Open Interest): Open Interest has been fluctuating but remains relatively high, suggesting continued market interest at these levels.
Conclusion on Direction: The market is at a critical juncture, testing the lower moving average support. A break below this area would confirm the continuation of the correction, while a hold could lead to a period of consolidation or a retest of the higher levels.
Support Levels (Downside Targets)
These are key levels where buying interest could emerge, potentially halting a decline.
- Immediate Support: ~8100 – ~8120 (Moving Average Confluence) This is the first line of defense, where the price is currently finding some support. It aligns with the cluster of both the short-term (red) and long-term (blue) moving averages. A decisive hourly close below this level would signal further downside.
- Minor Support: ~8000 (Psychological Level & Prior Consolidation) Below the moving averages, the 8000 level acts as a minor psychological support and a zone where the price has consolidated previously.
- Major Support: ~7800 – ~7850 (Multi-Day Low / Range Bottom) This is the major support level, representing the low of the recent multi-day range. A break below this level would be a significant bearish development, indicating a potential trend reversal on a larger timeframe.
Resistance Levels (Upside Barriers)
These are key levels where selling pressure is likely to increase, potentially pausing or reversing an upward move.
- Immediate Resistance: ~8200 – ~8250 (Prior Swing High & Resistance) This is the first barrier for the bulls, representing the level of the most recent minor swing high that will likely act as resistance on any bounce.
- Minor Resistance: ~8400 (Mid-Range Level) Higher up, this level has acted as both support and resistance in the recent past.
- Major Resistance: ~8600 – ~8650 (Prior Peak / Range Top) This is the top of the current consolidation range and a major resistance level. A decisive break above this level is needed to signal the resumption of the prior uptrend.
Summary Strategy
- Neutral: The market is in a “wait and see” mode, testing a key support zone.
- Bulls: Would need to see a confirmed breakout above 8250 (recent swing high) to target 8400 and then 8600.
- Bears: Would need to see a confirmed break below 8100 (moving averages) to target 8000 and then 7800.
Disclaimer: This technical analysis is for informational purposes only and does not constitute financial advice. Trading involves risk, including the loss of principal. Please conduct your own research or consult a professional financial advisor before making any trading decisions.
for more updates join our whatsapp group https://chat.whatsapp.com/Jrj3abV2S945BqYiQzOdk9