




Overall Directional Bias
The overall trend is Strongly Bullish (Upward).
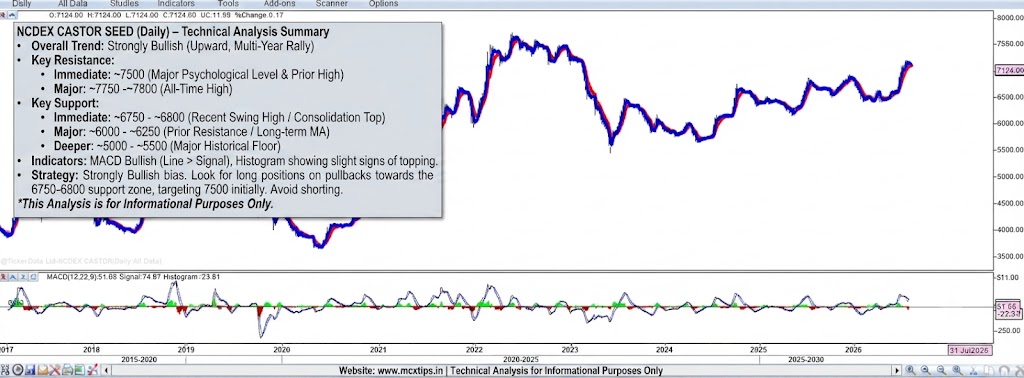
- Price Action: The chart displays a powerful multi-year uptrend, characterized by a series of higher highs and higher lows. The price has recently rallied strongly from a low near the 3500-4000 zone (around 2020-2021) to its current level of 7124.
- Moving Averages: The price is well above its short-term (red) and long-term (blue) moving averages, which are fanned out and sloping upwards, confirming the strength and persistence of the bullish trend.
- Indicators: The MACD indicator shows bullish momentum, with the MACD line above the signal line, although the histogram is showing slight signs of topping (beginning to flatten or slightly decrease in positive value), suggesting a potential for a short-term pause or consolidation, but not a reversal.
Support Levels (Downside Targets)
These levels are areas where buying interest is likely to emerge, halting a potential decline.
- Immediate Support: ~6750 – ~6800 This zone corresponds to recent minor swing highs and the top of a recent consolidation/pullback phase before the latest leg up. A pullback to this area would be a normal and healthy correction within the strong trend.
- Major Support: ~6000 – ~6250 Below the immediate support, this area represents a significant prior resistance level that should now act as strong structural support. This zone also aligns with the upward-sloping long-term moving average (blue line), adding confluence. A decline to this level would still be considered a buying opportunity within the broader trend.
- Deeper Support: ~5000 – ~5500 Farther down, this is a major historical support zone from the 2021-2022 period. A retest of this level would indicate a more significant trend reversal, but it remains a key long-term floor.
Resistance Levels (Upside Barriers)
These levels are areas where selling pressure is likely to increase, potentially pausing or reversing an upward move.
- Immediate Resistance: ~7500 This is a major psychological level and also corresponds to a significant prior swing high from early 2022. The market will likely pause or face selling pressure as it approaches this historical peak. A confirmed break above this level would signal the next major leg of the uptrend.
- Major Resistance (All-Time High): ~7750 – ~7800 Beyond the 7500 level, this is the major multi-year high. This is the ultimate target for bulls and will be a very difficult level to surpass without a significant catalyst.
Summary Strategy
The bias is firmly bullish.
- Aggressive Bulls: Could look for long positions on a minor pullback to the 6750-6800 support zone, targeting continued upside towards 7500 and eventually 7750, with a stop-loss just below the entry.
- Conservative Bulls: Might wait for a confirmed daily close above the 7500 resistance to confirm the breakout before entering new long positions.
- Shorting is strongly discouraged as the market is in a confirmed, strong uptrend and is making new highs. Any counter-trend trade carries significant risk.
Disclaimer: This is a technical analysis for informational purposes only and does not constitute financial advice. Markets are volatile and can change direction quickly. Please conduct your own research or consult a financial advisor before making trading decisions.
for more updates join our whatsapp group https://chat.whatsapp.com/Jrj3abV2S945BqYiQzOdk9