




Overall Trend Context
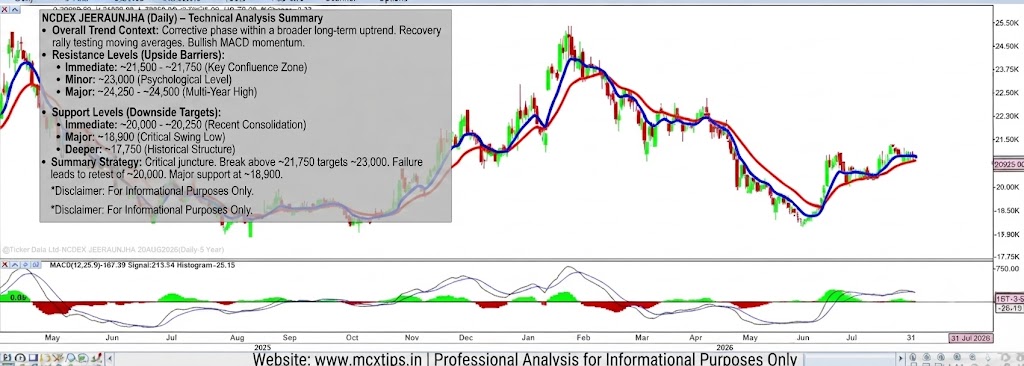
The market is currently in a corrective phase within a broader long-term uptrend. The price has recently pulled back significantly from its highs near ~24,500, formed a base around ~18,900, and is now experiencing a recovery rally. The price is currently testing the short-term (red) and longer-term (blue) moving averages. The MACD is showing bullish momentum, with the MACD line above the signal line and the histogram positive and expanding.
Resistance Levels (Upside Barriers)
These levels are based on recent price action and moving average convergence.
- Immediate Resistance: ~21,500 – ~21,750 This zone represents the current area of confluence where the price is struggling. It is the level of the most recent local highs and where the moving averages are currently clustered. A sustained break above this area is needed to confirm the continuation of the recovery rally.
- Minor Resistance: ~23,000 Higher up, this round number level acted as a previous support and then resistance during the initial decline from the highs.
- Major Resistance: ~24,250 – ~24,500 This is the major, multi-year high. A move to this level would indicate a full recovery of the prior downtrend. Breaking this level would be a very strong bullish signal.
Support Levels (Downside Targets)
These levels are based on prior swing lows and consolidation areas.
- Immediate Support: ~20,000 – ~20,250 This is the first level of short-term support, representing the recent consolidation range and the top of the latest breakout candle.
- Major Support: ~18,900 This is the critical major swing low and the primary level to watch. It acted as the floor during the recent sell-off. A break below this level would signal a continuation of the downtrend and invalidate the current bullish recovery setup.
- Deeper Support: ~17,750 Below the major support, this level represents a historical point of price structure from late 2024.
Summary Strategy
- The market is at a critical juncture, testing the moving averages. A break above the ~21,750 resistance would target ~23,000.
- Traders are likely watching to see if the price can clear this immediate hurdle. Failure to do so could lead to a retest of the ~20,000 support.
- The ultimate “line in the sand” for the bullish case is the ~18,900 major support.
Disclaimer: This technical analysis is for informational purposes only and does not constitute financial advice. Futures trading involves substantial risk of loss.
for more updates join our whatsapp group https://chat.whatsapp.com/Jrj3abV2S945BqYiQzOdk9