




Overall Trend Analysis (Direction)
The overall medium-term trend is Bullish (Upward), but the very short-term outlook is currently Neutral to Slightly Bearish as the price experiences a correction.
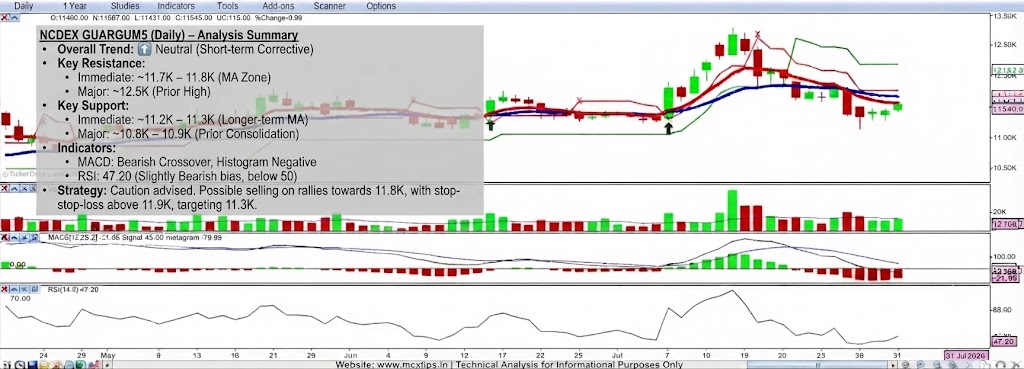
- Price Action: The price has been in a sustained uptrend since May 2026, forming a series of higher highs and higher lows. It recently broke above the 6000 level, reaching a high near 6300. However, the last few candles show a pullback, with the price falling back below the 6000 level. The price is currently caught between the short-term (red) and longer-term (blue) moving averages.
- Moving Averages: The longer-term blue moving average is still sloping upwards, confirming the underlying bullish trend. The shorter-term red moving average is beginning to flatten and turn down, reflecting the recent selling pressure.
- Indicators:
- MACD: The MACD line has crossed below the signal line, and the histogram has turned negative. This is a bearish signal indicating that momentum is shifting to the downside.
- RSI (Relative Strength Index): The RSI is currently at 48.86, which is just below the 50-midpoint. This suggests that bearish momentum is slightly stronger than bullish momentum in the immediate term. The RSI is not overbought or oversold, leaving room for movement in either direction.
Conclusion: While the primary trend remains up, the recent price action and indicators suggest a short-term correction is underway. The key will be to see if the price finds support at lower levels.
Support and Resistance Levels
These levels have been derived from recent price action and key moving averages.
Resistance Levels (Upside Barriers)
- Immediate Resistance: ~6000.00 (Psychological Level / Prior Support) This round number is the first significant hurdle for the price to reclaim. A failure to break back above this level could lead to further selling.
- Major Resistance: ~6150.00 – ~6300.00 (Recent High Zone) This zone represents the recent multi-month high. Overcoming this area would be a strong bullish continuation signal.
Support Levels (Downside Targets)
- Immediate Support: ~5900.00 (Long-term Blue Moving Average) This area currently acts as a dynamic support level. The blue moving average has provided support on previous pullbacks.
- Major Support: ~5750.00 – ~5800.00 (Prior Consolidation Zone) Below the moving average, this zone is a more significant area of prior price consolidation where buyers stepped in previously. A break below this level would signal a deeper correction.
Summary Strategy:
- The current bias is cautiously bearish in the short term due to the MACD crossover and RSI dipping below 50.
- Short-term traders could look for shorting opportunities on rallies towards the ~6000.00 resistance, with a stop-loss just above that level, targeting a move towards the ~5900.00 support.
- Long-term investors should view this pullback as a potential buying opportunity, provided the price holds above the major support zone of ~5750.00 – ~5800.00.
- A decisive break back above 6000.00 would neutralize the short-term bearish outlook and shift the bias back to bullish, targeting the recent highs.
Disclaimer: This is a technical analysis for informational purposes only and does not constitute financial advice. Markets are volatile and can change direction quickly.
for more updates join our whatsapp group https://chat.whatsapp.com/Jrj3abV2S945BqYiQzOdk9