




Overall Trend Analysis (Direction)
The overall trend is clearly Bullish (Upward).
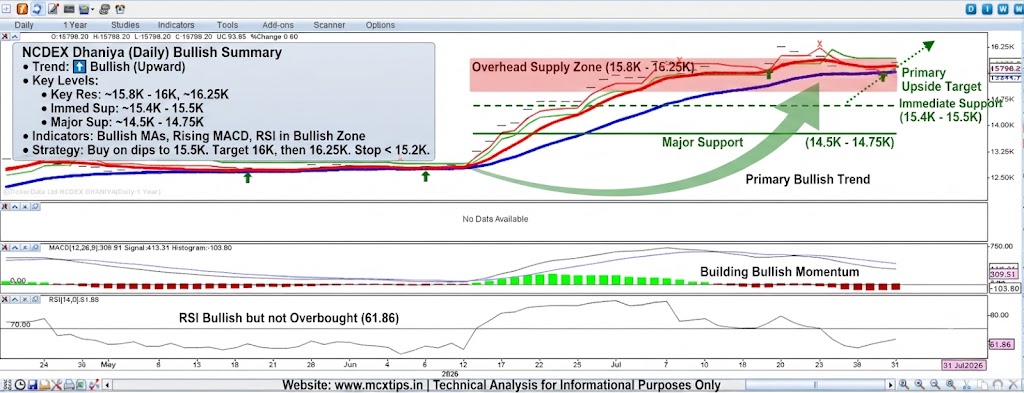
- Price Action: The chart shows a strong, sustained rally starting from a consolidation zone near 12.5K. The price has formed a series of higher highs and higher lows, indicating a clear upward bias. It is currently trading above its key short-term (green) and longer-term (red) moving averages, which have crossed in a bullish configuration and are fanned out upwards. The most recent candles are showing a minor pullback or consolidation after reaching new highs, which is normal in a strong trend.
- Indicators:
- MACD: The MACD line is above the signal line, confirming bullish momentum. While the histogram bars are currently red and decreasing, they are still positive, suggesting a temporary pause in momentum rather than a reversal.
- RSI (Relative Strength Index): The RSI is at 61.86. This level is in the bullish zone (above 50) but is not yet in overbought territory (above 70), meaning there is still room for the price to move higher before becoming overextended.
Conclusion: The direction is up. The path of least resistance remains to the upside, and traders should look for buying opportunities on pullbacks towards support levels.
Support and Resistance Levels
These levels have been derived from recent price action and key points on the chart structure.
Resistance Levels (Upside Barriers)
- Immediate Resistance: ~15.8K – ~16K (Recent Highs / Psychological Level) The price has recently tested the 15.8K level and is just below the major psychological level of 16K. A decisive break above this zone would be a strong continuation signal.
- Major Resistance: ~16.25K (Prior Historical High Zone) Further up, the historical peak zone from earlier in the period represents the next significant long-term overhead supply zone.
Support Levels (Downside Targets)
- Immediate Support: ~15.4K – ~15.5K (Prior Consolidation High / Moving Average Zone) This zone, where the shorter-term green moving average is converging, is the first line of defense. A successful retest of this area would be a healthy bullish pullback.
- Major Support: ~14.5K – ~14.75K (Prior Mid-Range Support / Longer-term MA) Below that, this area represents a more significant prior consolidation zone where the longer-term red moving average is now approaching. A break below this level would signal a potential change in trend.
- Deeper Support: ~13.25K (Prior Range Top) Further down, the 13.25K level is a major structural support level, representing the top of the previous multi-month range.
Summary Strategy:
- The current bias is firmly bullish.
- Short-term traders could look for buying opportunities on minor pullbacks towards the ~15.4K – ~15.5K support level, with a stop-loss just below that level (e.g., ~15.3K), targeting the ~15.8K – ~16K resistance level.
- A confirmed break above the ~16K level would be a strong continuation signal, targeting a move towards ~16.25K.
- A breakdown below the ~14.5K support level would be a significant bearish reversal signal, suggesting a deeper correction towards ~13.25K.
Disclaimer: This is a technical analysis for informational purposes only and does not constitute financial advice. Markets are volatile and can change direction quickly.
for more updates join our whatsapp group https://chat.whatsapp.com/Jrj3abV2S945BqYiQzOdk9